American Airlines Stock Deep Dive: AAL price target at $15 so HOLD for stable demand despite rising recession

American Airlines (AAL) stock is next in line on our deep dive series, with a timely look at the aviation sector. With oil prices and inflation both weighing heavily on investors' minds, consumer demand remains strong as the pent-up energy of the pandemic is still unwound. What we need to determine is how this can be extrapolated into a fair valuation for American Airlines and how to invest accordingly. Our deep dive focuses on the two main valuation methods: forecasting a per-share value based on the discounted cash flow method and also using a relative valuation method that compares AAL against its peer group using traditional price ratios. Where we differ from the Wall Street analyst community is our focus on the overall market theme and economic backdrop as both influence market direction independent of company-specific performance. We also add in some technical analysis to further distance ourselves from the analyst community and look for points of price equilibrium on long-term charts. This leads us to our final 12-month price target.
Contents
- Company overview and history
- Wall Street consensus forecasts
- Key valuation rating metrics
- Peer value comparison
- Macroeconomic backdrop, market cycle and sector analysis
- Recent news and earnings
- Forecast and valuation
- Technical analysis
- Executive summary, recommendation and price target
American Airlines: Company overview and history
American Airlines is the world's largest airline by fleet size and number of passengers carried and was formed in its current guise by the merger of AAL and US Airways in 2013. Following the 2008 Great Financial Crisis, numerous airlines faced potential bankruptcy, and consolidation in the industry was commonplace. American Airlines, through its parent company AMR, was in Chapter 11 bankruptcy protection before the merger. American Airlines trades on the Nasdaq under the ticker AAL and is a constituent member of the S&P 500. The original American Airlines Group has been in operation since 1930 and is currently headquartered in Texas. AAL operates a fleet of nearly 900 aircraft, although recent rumors have circulated that it may look to reduce fleet numbers.
Also Read: Tesla Stock Deep Dive: Price target at $400 on China headwinds, margin compression, lower deliveries
The pandemic hit all stocks, but with borders being closed globally airline travel was especially impacted. This has meant American Airlines stock has underperformed notably versus both the Nasdaq and S&P 500. American is not alone though as all airlines underperformed the main indices during the pre and post-pandemic recovery. During that time airline travel faced many restrictions and challenges that still exist in part today. Oil prices have surged. Despite demand increasing for international travel, airlines are facing labor shortages for pilots and cabin crew. This has meant having to increase salaries and ticket prices.
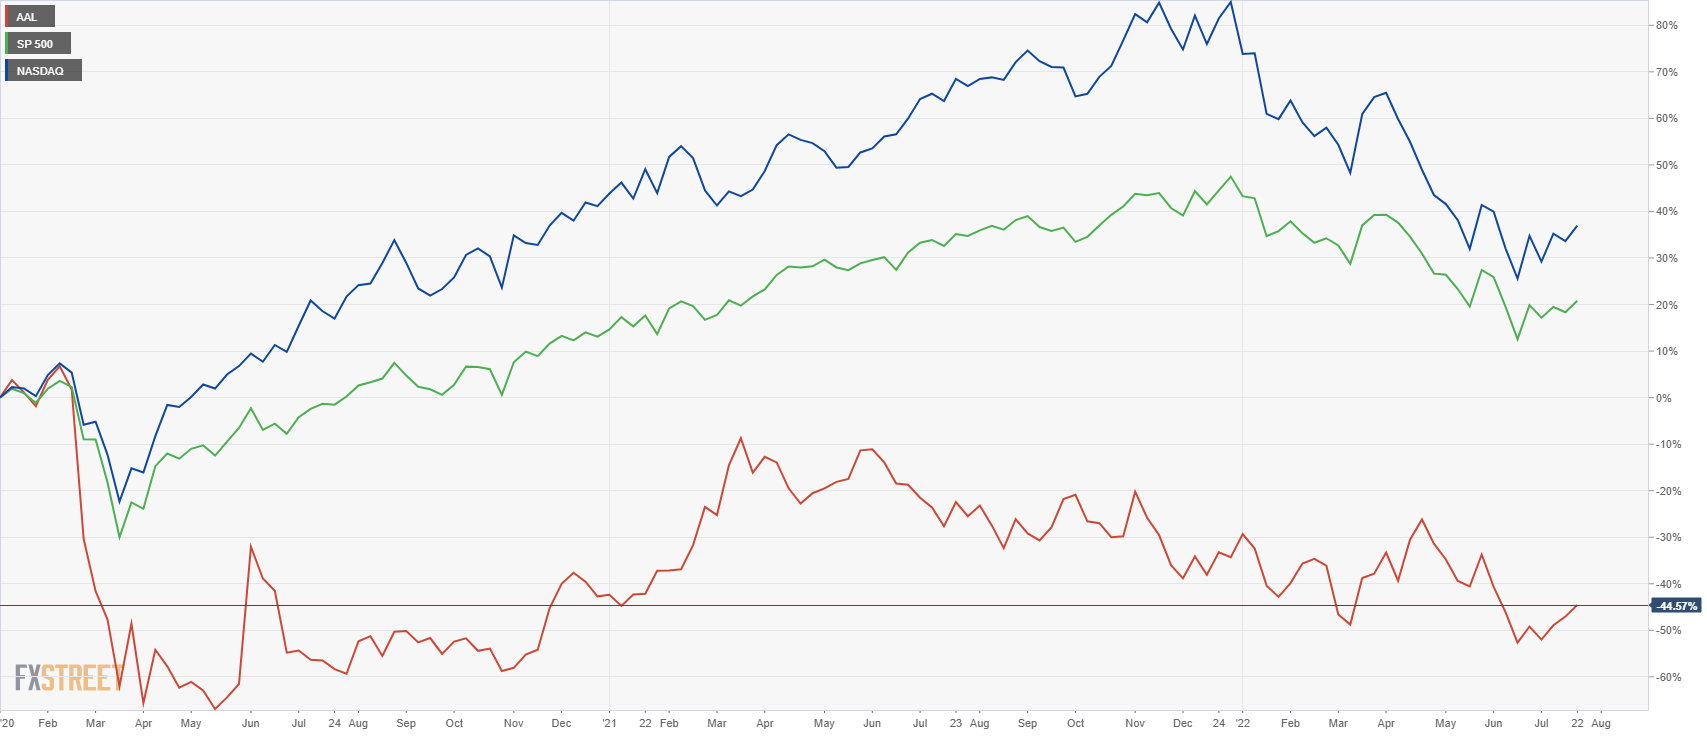
American Airlines (red) versus S&P 500 (green) and Nasdaq (blue) back to February 2020
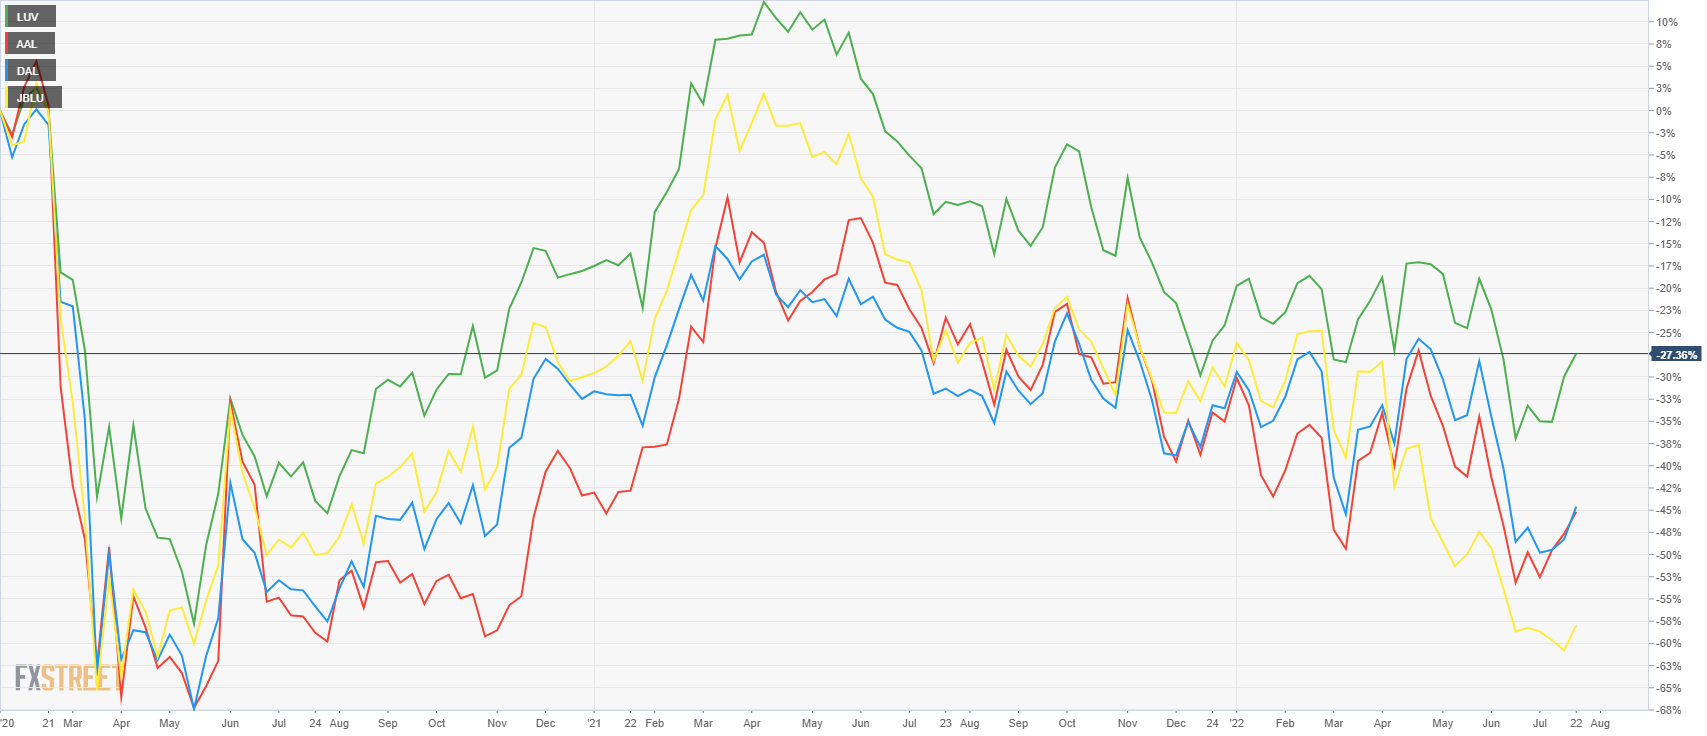
Southwest (green), American (red), Delta (blue), and Jet Blue (yellow). PErformance since February 2020.
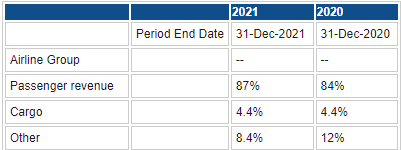
American Airlines derives nearly all of its revenue from commercial airline passengers with a very small proportion from cargo.
Source: Refinitiv and FXStreet
AAL Stock: Wall Street Consensus Forecasts
Source: Refinitiv and FXStreet
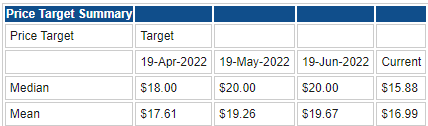
Wall Street analysts are highly optimistic, as usual, with an average price target of nearly $17 at the mean. This represents approximately a 15% upside from the current AAL stock price of just over $15. This is relatively pessimistic by Wall Street standards and represents concerns over rising inflation hitting demand and continued margin pressures from inflation. American Airlines releases earnings on July 21.
Key Valuation rating metrics
Market cap: $9.7 billion
Enterprise value: $44 billion
52-week high: $22.35
52-week low: $11.93
Short interest: 12%
YTD performance: -20%
5-year performance: -71%
Peer value comparison
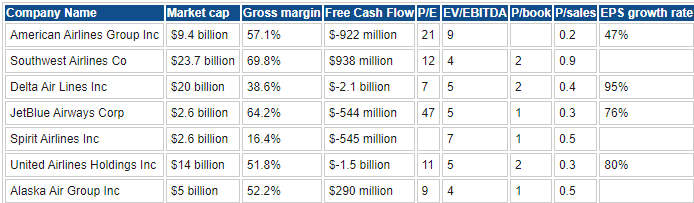
Source: Refinitiv and FXStreet
Macroeconomic backdrop, market cycle and sector analysis
Here is our first major point of differentiation versus Wall Street. We have to take into account the market cycle we are in and the macro background, both of which drive stock valuations. There is some point to having a laser-like focus on company performance, and we can never compete with Wall Street analysts on this front. They have more time, more resources, and more company access to gain insight concerning detailed aspects of company performance, accounting, etc. However, stock prices are driven by earnings, which are a factor of company performance that is largely dominated by the macroeconomic cycle. American Airlines (AAL) is a consumer discretionary stock and thus is even more susceptible to macroeconomic conditions that directly impact its bottom line performance. There is no doubt that high oil prices, rising inflation, and weakening consumer sentiment are challenges for all airlines.
Also read: Walmart Deep Dive Analysis: Hold WMT to play defense vs upcoming US recession
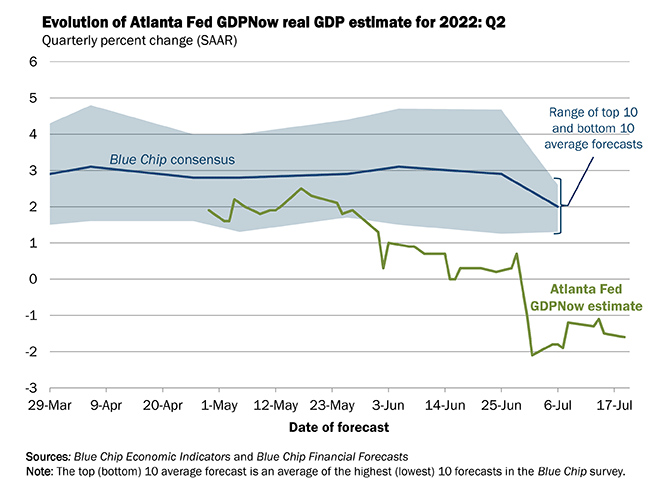
For starters, we are in a bear market across the main indices. The average bear market runs to a decline of about 40% during the US recession and 30% without. The best case based on history then is another 10% downside. Currently, we do not expect a deep US recession, but that may change. We are forecasting one in late 2022 or early 2023. The latest data from the Atlanta Fed suggests we may already be in a US recession. This has been negative for several weeks and combined with the Q1 negative GDP print would confirm a US recession.
Consumer sentiment is already falling to multi-decade lows, and this will impact directly on consumer discretionary spending, albeit with a time lag of 6-9 months usually.
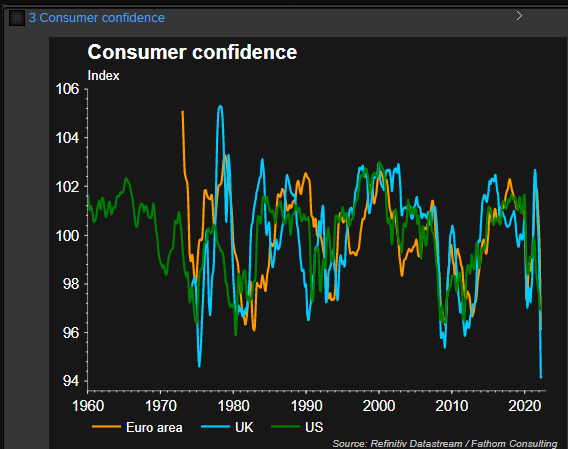
Consumer confidence eventually leads to lower spending, but so far the main US banks are seeing consumer spending and demand hold up relatively well. Despite JPMorgan CEO Jamie Dimon's widely publicized "hurricane" quote, so far consumer spending is holding up. However, that is lagging data, and sentiment tends to be more forward-looking. US CEOs are growing increasingly worried about the state of the US economy and the US consumer. Consumption makes up about 70% of US GDP. From Jamie Dimon's "hurricane" to Elon Musk's "super bad feeling", CEOs are mirroring this decline in consumer confidence.
Airlines are also faced with an additional hurdle of rising oil costs, which follow directly through to US jet fuel prices. The chart below shows the obvious correlation. This naturally directly impacts the airline industry's cost base.
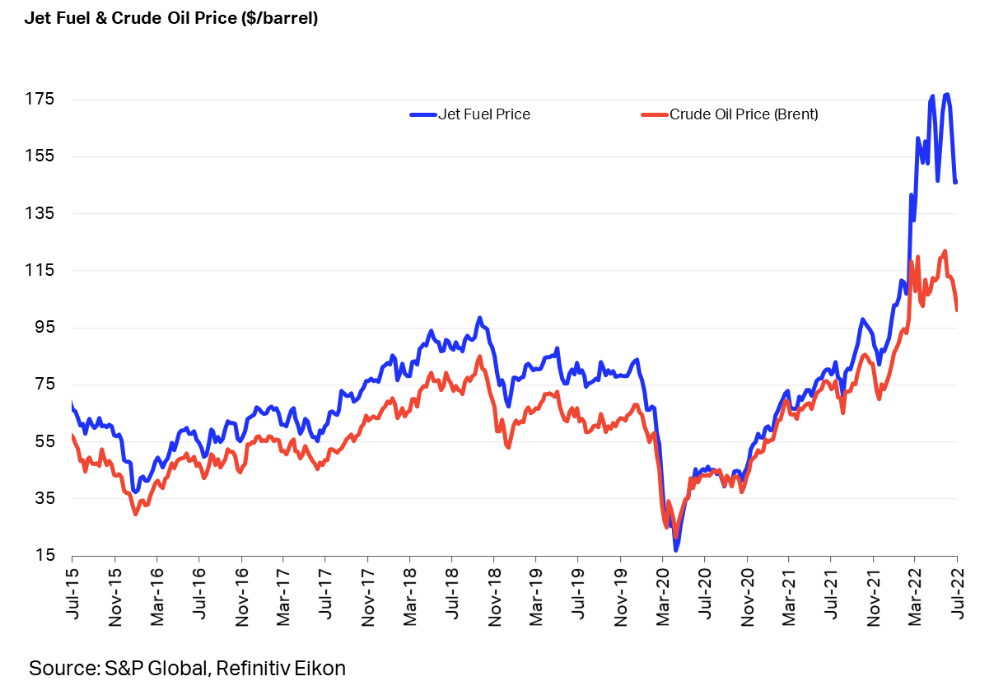
Oil prices are highly cyclical and subject to global demand. Inflation is forecast to dent that demand, which has seen oil prices move markedly lower over the past month, even dipping below $100 and back to pre-Ukraine invasion levels. This at least has some positives for the airline industry, although lower oil demand usually results in lower overall demand, meaning fewer people flying. Consumer demand lags at various stages of the cycle, but already driving season in the US has been impacted by higher prices.
#Gasoline consumption ⬇ on high prices just as the US summer driving season gets into full swing. Not since 2003 has the Energy Department’s measure of total implied demand ⬇ at a similar velocity as at the start of July, according to BI commodity strategist Mike McGlone. pic.twitter.com/XWk2iCKrZi
— Christophe Barraud (@C_Barraud) July 20, 2022
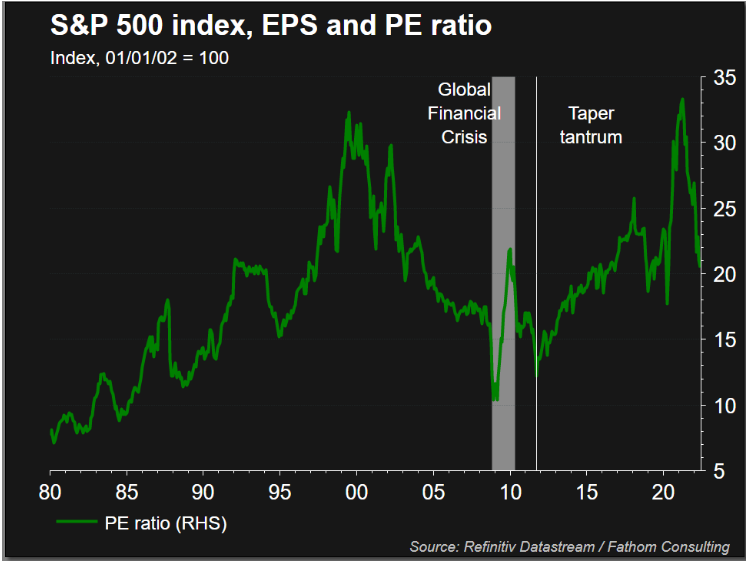
Heading into a possible US recession and already inflationary environment, we need to check what happens to equity valuations in such an environment. As ever, an element of estimation is involved, especially as this environment is unique to most of us. We have never experienced such an inflationary environment in our lifetimes. A recession should take corporate profitability lower to the tune of at least 20% on an EPS basis. The good news is that markets are forward-looking and appear to be even more so at the present point in time. The average price/earnings ratio for the S&P 500 has already moved significantly lower from nearly 40 back to a more average looking 20. In a recession, it usually trades nearer to 15.
Recent American Airlines news and earnings
Only as recently as June 3 did American Airlines warn that higher oil prices were impacting its business. The company had appeared to issue an upbeat forecast as it said demand was strong leading to predicted solid revenue growth. As mentioned though, markets are forward-looking, and warnings over higher oil prices sent AAL stock lower to the tune of about 7%. American said it was expecting revenue to rise 12% at the midpoint over pre-pandemic levels. This was an upgrade from its previous revenue guidance of 7%. American said it saw fuel expenses rising from $3.62 to $3.94 per gallon though. The airline is also facing labor shortages as it struggles to hire pilots.
Earnings for the first quarter were announced on April 21. Earnings per share (EPS) beat estimates by 8 cents, $-2.32 versus $-2.40. Revenue also beat forecasts, $8.9 billion versus $8.8 billion.
American Airlines released Q2 earnings on July 21. EPS and revenue were both beats, 0.76 vs 0.74 expected and 13.42B vs 13.40B forecast respectively.
American Airlines forecast and valuation
We use both discounted cash flow and relative valuation models to determine our fair value for AAL stock. We then adjust for the macro environment and technical analysis to come up with our definitive 12-month price target for AAL. As with all methods, none are perfect, but at least using multiple models allows us to reach a more detailed estimate.
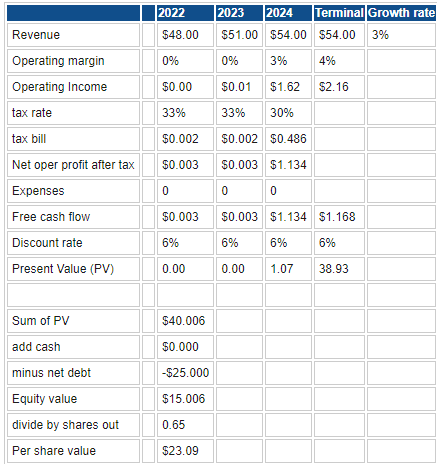
First, we use a discounted cash flow model. This takes cash flow projections into the future, discounts them to the current value, and divides by the number of shares to come up with a fair value per share.
Source: Refinitiv and FXStreet
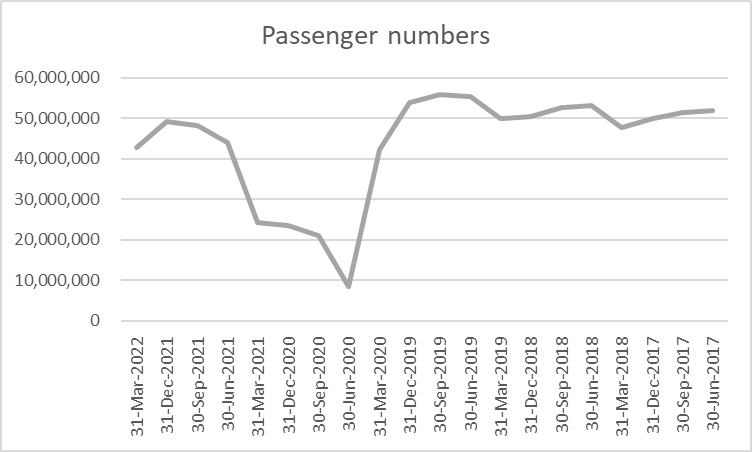
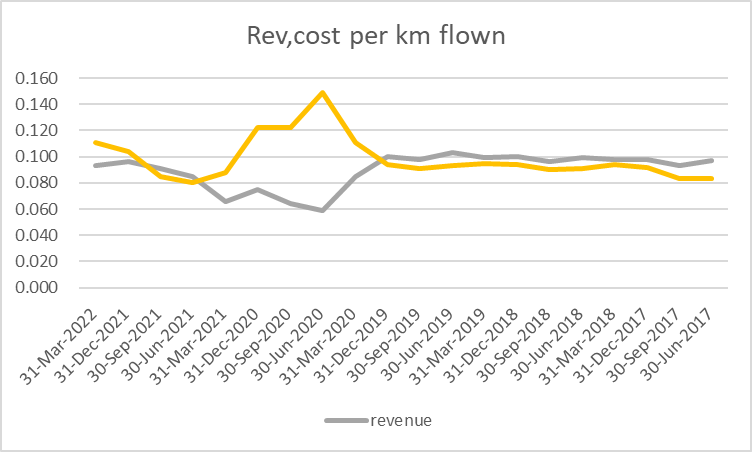
We have used a growth rate of 3% and a discount rate of 6%. Rising interest rates are a significant risk to American Airlines as it historically carries a lot of debt, as do many in the airline industry. The growth rate at 3% is generous again based on historical precedent, but it is the industry standard. Reminder: the growth rate is the expected growth rate of the firm's free cash flows (FCF) in perpetuity, or forever in normal speak. This is a huge assumption in my view that AAL will grow its FCF at all. Its track record is not strong in this area. Reducing the growth rate from 3% to 2% gives a DCF valuation of $0.02, so you can see just how fragile this guestimation is. As we can see from the passenger numbers below, American Airlines has yet to recover to pre-pandemic levels, and the lower chart shows us that costs are still outpacing revenue on a per kilometer basis.
Source: Refinitiv and FXStreet
Source: Refinitiv and FXStreet
Source: Refinitiv and FXStreet
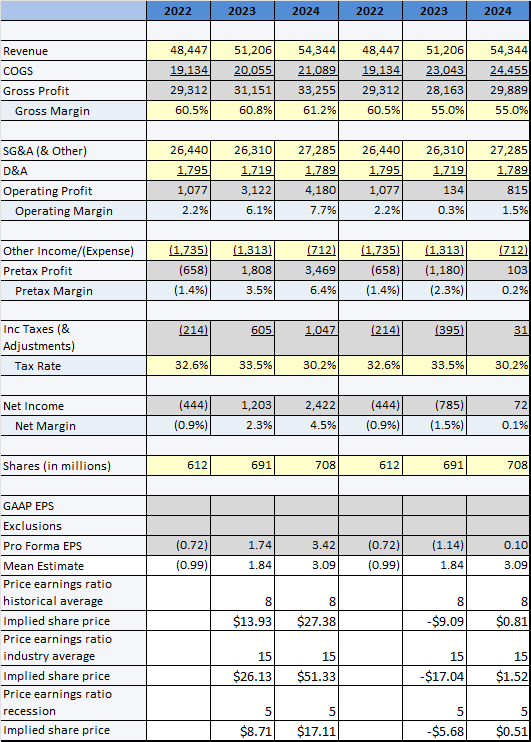
We have run through some comparative valuation scenarios above. We have first taken the consensus forecasts from Refinitiv and used three differing P/E scenarios. The historical average P/E for American Airlines is 8, the industry average P/E is at 15, and finally a recession-based P/E is observed. Assuming current margin forecasts gives a valuation of $13.93 – or $26.13 using the average P/E. We have then adjusted for margin compression, which we feel is inevitable in the current inflationary environment. We have not changed revenue forecasts despite what we have outlined previously from falling consumer confidence and falling consumption in the face of rising prices.
The pandemic generated sufficient pent-up demand to take American Airlines through 2023 on the revenue side, but margins will be hit. This is a worst-case scenario about margin compression, we should state, but given that we expect demand to hold up we will opt to use current margins around the 60% level. American should be able to increase prices and maintain revenue growth as demand has not yet been met in 2022, and we think it will spill over in 2023.
This allows us to opt for consensus revenue and margin forecasts giving us a price target range of $8.71 to $26.13. The US is likely to enter or has already entered a recession, so this means we discard the 15-time multiple in favor of the 5 to 8 range and so an adjusted price target range of $8.71 to $13.93. Adding in our DCF model above at $20.39 means based on current modeling and the current AAL stock price at $15.16, we are somewhat neutral. Let us add in some technical analysis before determining our final price target.
American Airlines: Technical analysis
We found this especially interesting given how on the long-term monthly chart American Airlines stock is reaching critical support. Given the Great Financial Crisis in 2008 when AAL stock bottomed at $1.45, we would not expect a repeat performance as we do not expect a repeat of 2008. $12 is then a massive support level.
AAL stock also huge volume profile at this level indicating price acceptance and adding to support. The post-pandemic consolidation zone just below $9.50 to $14.50 is a further addition to the supporting argument around this zone. Resistance remains at $26 from the bearish double top in March and June 2021.
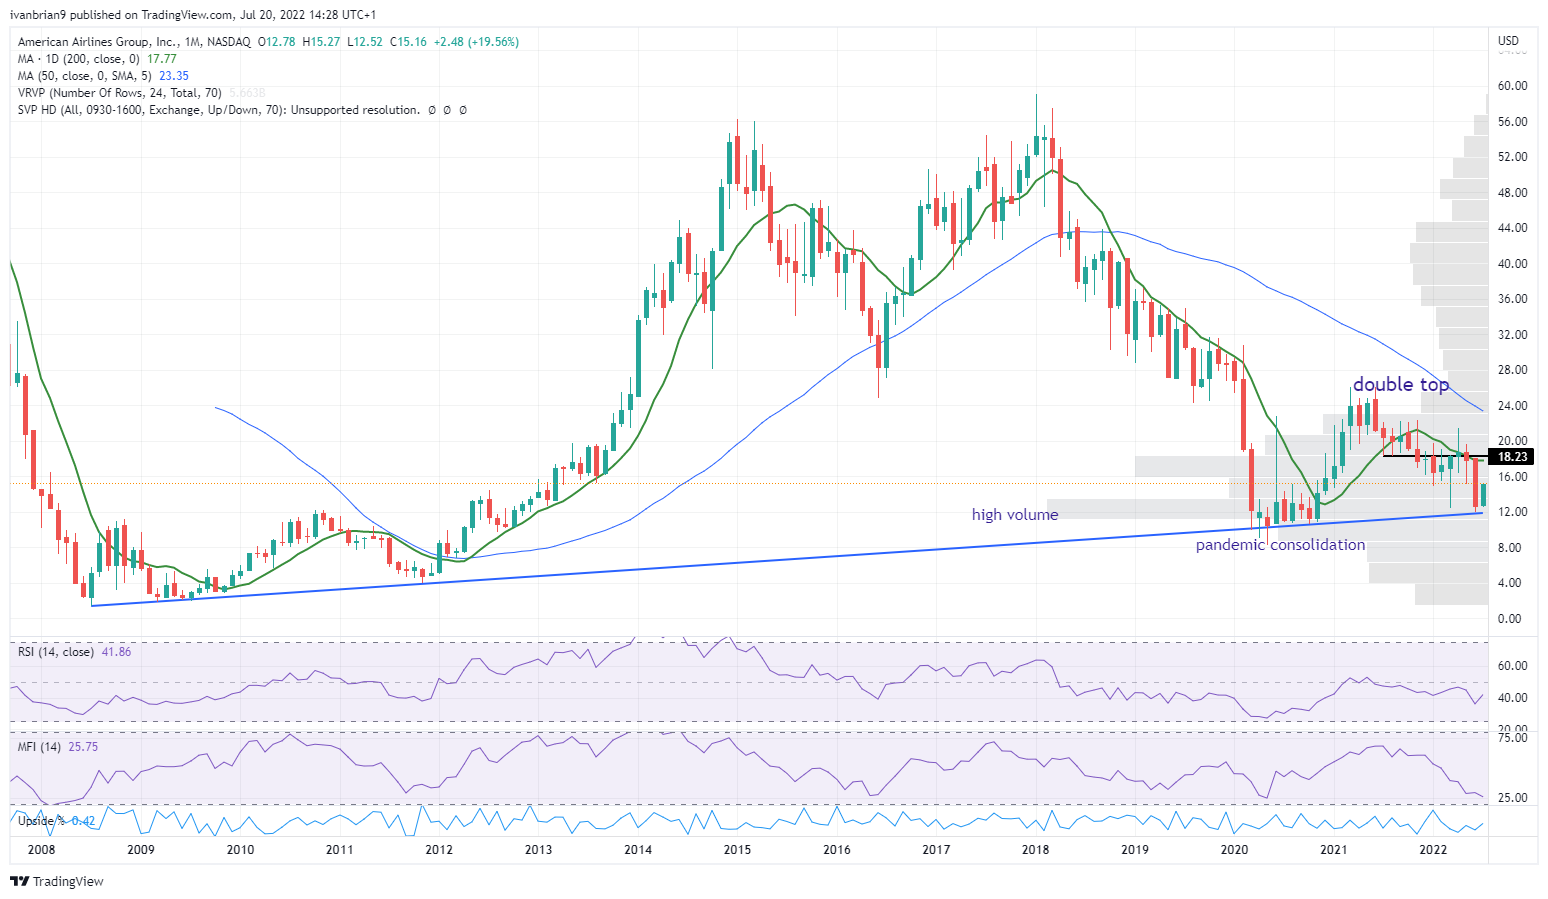
American Airlines (AAL) chart, monthly
American Airlines: Executive summary, recommendation, and price target
Overall then we are happy to place a 12-month price target of $15 and a Hold rating on American Airlines. The DCF valuation was higher, but we were uncomfortable with the long-term growth rate assumption given the historical precedent for heavy losses and government bailouts. We feel demand should hold steady despite rising costs, and margins can be at best maintained. This would have led to a higher valuation, but we are adjusting our P/E model to reflect the current bear market and likely recession. We feel revenue and margin estimates will likely be met, but a higher rating multiple is highly unlikely in the current environment. Technically, we are more comfortable with large support at $12, but a break would mean a move toward a new trading range of $4 to $8.
Upside risks to our target
- Oil prices continue to fall.
- Bear market ends, unlikely in our view based on historical trends.
Downside risks to our target
- Technical break of strong support.
- Oil prices return to record highs.
- Demand falls based on a likely US recession.
Premium
You have reached your limit of 3 free articles for this month.
Start your subscription and get access to all our original articles.
Author

Ivan Brian
FXStreet
Ivan Brian started his career with AIB Bank in corporate finance and then worked for seven years at Baxter. He started as a macro analyst before becoming Head of Research and then CFO.


