|premium|

AMC Entertainment Holdings Stock Price and Forecast: Why is AMC going to the moon?

  • AMC shares keep on squeezing, surging nearly 9% on Tuesday.
  • The meme stock is due to break key $48 resistance level.
  • The entertainment giant stock broke the key $40 level and has not looked back since.

The move keeps on going for AMC shares, which have traded perfectly from a technical setup, as retail traders show they look at charts as well as movies. The move was started by the break of $40, which had held the range for most of the summer. Some technical indicators began to perk up on the bullish side, and this created momentum to bring more buyers in to keep the move going. A short squeeze has been mentioned as one of the main reasons, but it is the continuing focus on key technical levels and how to squeeze positions that are more impressive.

Momentum creates momentum and this is certainly a feature of AMC. Having broken $40, AMC stock came back and retested the level last week but importantly held the level. A retest not only provided those who missed it a second chance to jump on board the long train, but confirms the bullishness. From a psychological point of view, buyers push the stock higher, sellers come in and push it back to the breakout level where once again more buyers step in and defend the level. This reinforces the breakout level. Now, the bullishness is firmly in place and the momentum oscillators are trending higher to confirm. 

AMC key statistics

Market Cap$22.3 billion
Price/Earnings 
Price/Sales3
Price/Book 
Enterprise Value$36 billion
Gross Margin-0.74
Net Margin

-3.15

52 week high$72.62
52 week low$1.91
Average Wall Street Rating and Price TargetSell $5.44

AMC stock forecast

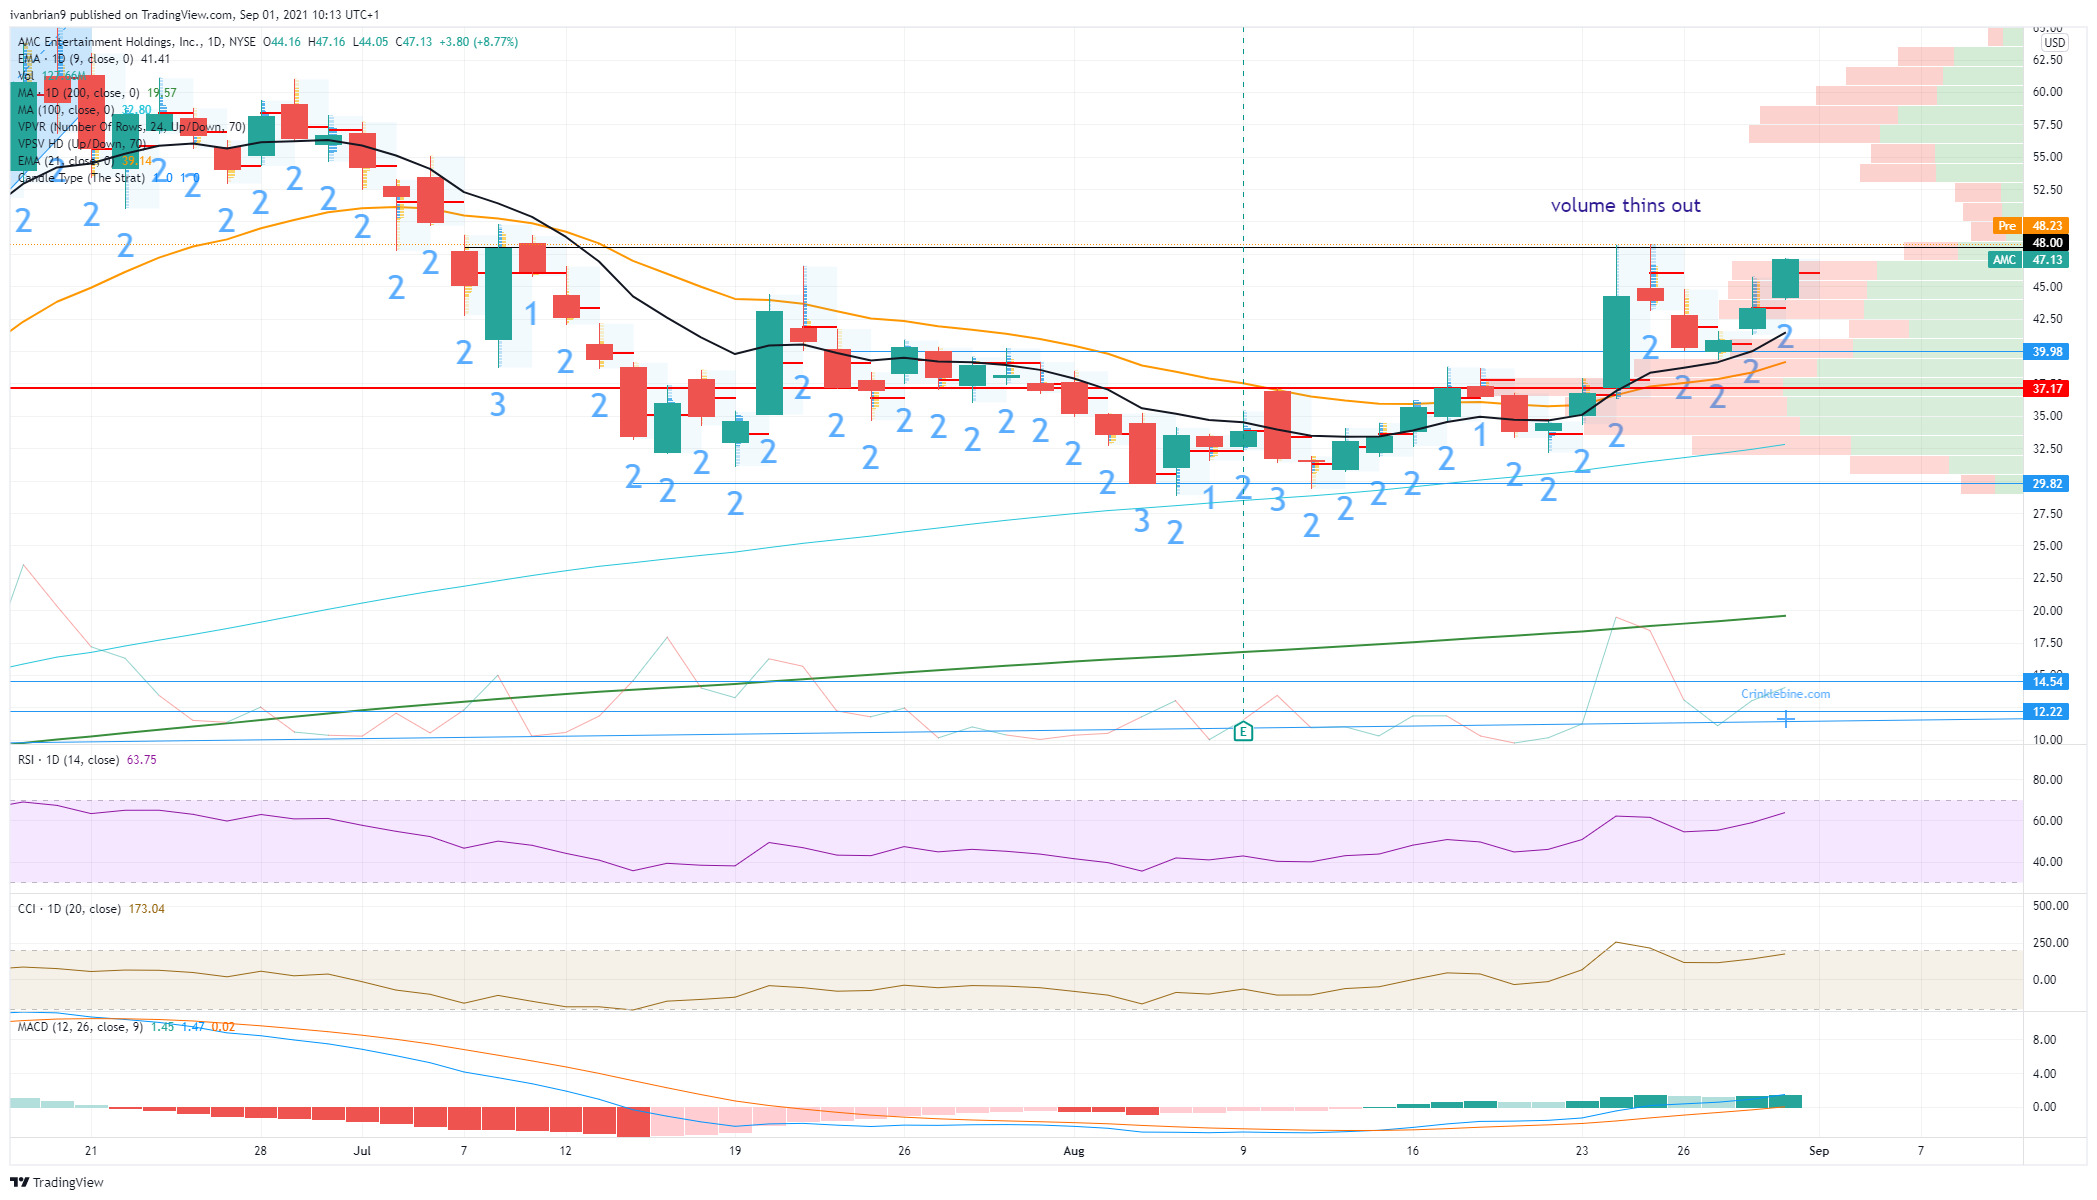
We can see from the volume profile on the chart below why we want AMC to keep going and breach $48. The volume profile shows that, once through, it gets easier for bulls or AMC apes to keep the party bull bus going all the way to $58 where volume picks up again. The momentum oscillators are all pointing in the right direction, helping to confirm the trend and the Moving Average Convergence Divergence indicator has pushed into a bullish crossover. The level to hold is still $40, as this keeps AMC bullish. Premarket indications are good with AMC already printing at $48.30, so it seems like more attention is being gained from Tuesday's move.

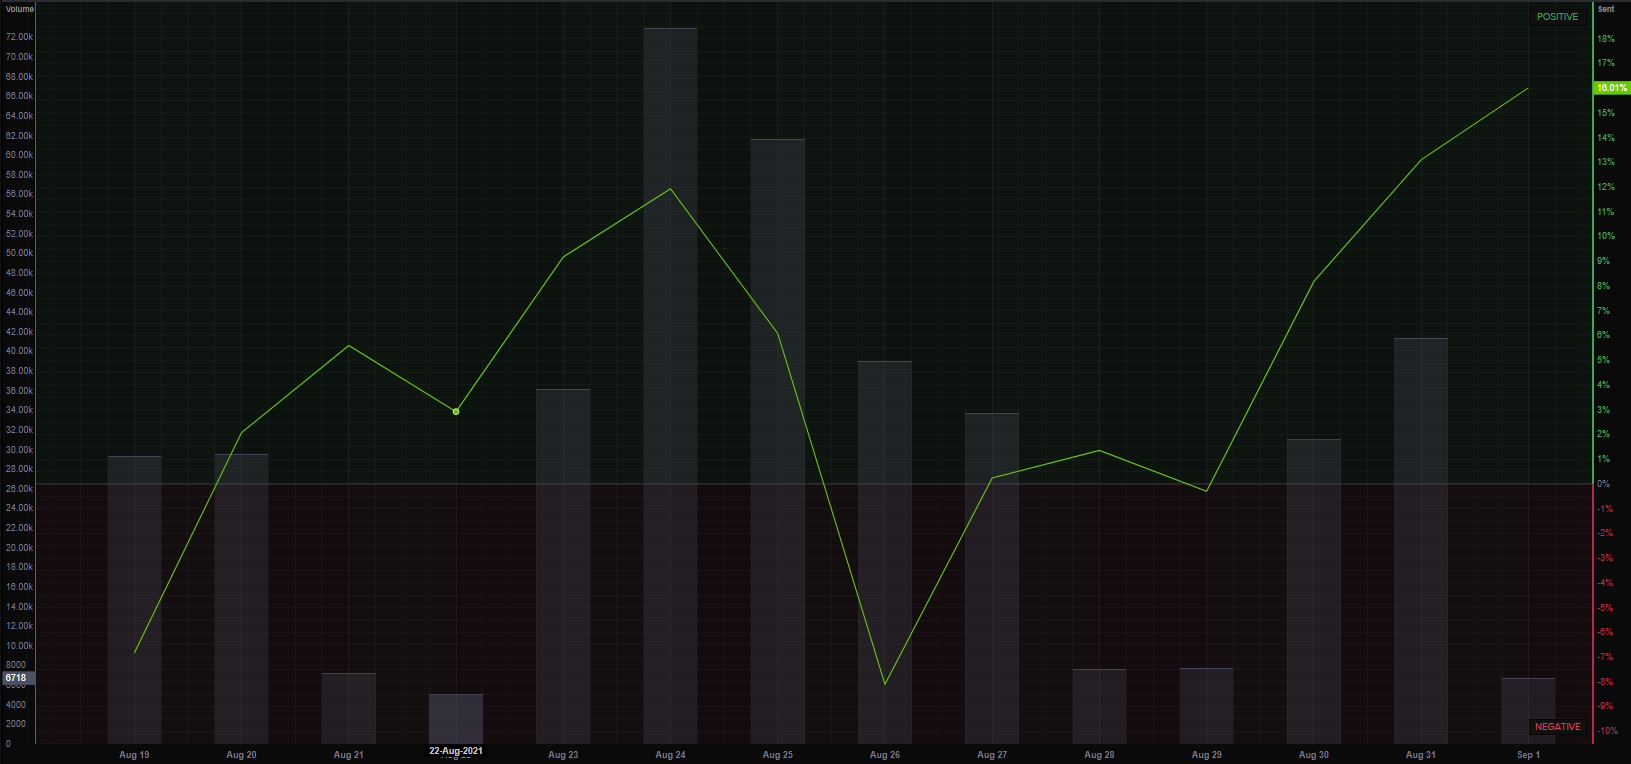
The Refinitiv social media sentiment monitor below shows the spike in attention:

The daily chart below shows a dip in volume above $48 meaning a break should accelerate. Volume has also been increasing on a daily basis but has yet to hit the peak from the breakout on August 24, so we have more room for new volume to enter and keep the momentum going.


Like this article? Help us with some feedback by answering this survey:

Premium

You have reached your limit of 3 free articles for this month.

Start your subscription and get access to all our original articles.

Subscribe to PremiumSign In

Author

Ivan Brian

Ivan Brian

FXStreet

Ivan Brian started his career with AIB Bank in corporate finance and then worked for seven years at Baxter. He started as a macro analyst before becoming Head of Research and then CFO.

More from Ivan Brian
Share:

Editor's Picks

EUR/USD seems fragile below 1.1700 as Middle East war boosts energy prices

The EUR/USD pair trades flat at around 1.1680 during the Asian trading session on Tuesday, but broadly seems vulnerable, being close to its five-week low. The major currency pair is under pressure as surging oil prices due to the United States-Israel war with Iran have increased the risks of higher inflation for the Old Continent.

GBP/USD hovers around 1.3400 with bearish pressure intact

GBP/USD edges higher after three days of losses, trading around 1.3400 during the Asian hours on Tuesday. The technical analysis of the daily chart indicates an ongoing bearish bias, as the pair trades within a descending channel pattern.

Gold sticks to gains above $5,350 amid sustained safe-haven demand; firmer USD caps gains

Gold sticks to its positive bias for the third straight day and trades above the $5,350 level heading into the European session on Tuesday. Concerns about a broader regional conflict in the Middle East continue to weigh on investors' sentiment and underpin demand for the traditional safe-haven bullion.

Stellar risks deeper losses as derivatives metrics turn negative

Stellar is trading red below $0.16 at the time of writing on Tuesday, after a slight recovery the previous day. Weakening derivatives data caps the recovery, while an unfavorable technical outlook projects a deeper correction for the XLM token in the upcoming days.

The market is not panicking it is repricing the probability distribution of Oil and time

At the end of the day, markets do not trade morality or geopolitics. They trade transmission channels. And the only channel that truly matters in this maelstrom runs through the price of energy and the time value of money.

Hyperliquid Price Forecast: HYPE rises on commodities demand amid US-Iran war

Hyperliquid (HYPE) steadies above $33 at press time on Tuesday, marking its fourth consecutive day of recovery in a broadly volatile market due to the ongoing US-Israel strikes on Iran.