The Checklist: How to prepare for your trading day

Below I’ve created a checklist, which will help you correctly prepare for the trading day. Most of the work in trading is done before the market opens. Some, the better you prepared, the more stable your trading is going to be.
Step 1. Are you emotionally and physically capable to trade today?

That’s right – your first question should be not about the markets, but about yourself. Are you feeling healthy today? Did you sleep well at night? Did you have any stressful situations today or the day before?
You are the main trading instrument – don’t underestimate the importance of your physical and mental state! Experiments with poker players have shown that people tend to be more risk seeking and less prudent after sleep deprivation and other unusual physical states. Just don’t trade if you have one. Go take a rest.
Also, if you are anxious about the stressful situation outside the market, resolve the situation and get back to trading after that. Markets will be there tomorrow. You will do a good job as a risk manager removing yourself from the process for a while.
Step 2. Do markets await important news or economic releases?
Traders often forget about economic releases which can make volatility explode. They just forget, too much focusing on chart analysis. Surprisingly, a big move appears “from nowhere” and wipes out our trader from a position.
To avoid getting caught in similar circumstances, it’s worth opening economic calendar and watching whether any important releases are underway. I prefer to use this one since it’s very convenient, but you can use other of your choice, or even watch calendars of events on official websites of FED and other institutions.
Not all releases influence all markets, some are local (like interest rate decision from B
ank Of New Zealand, for example), some influence markets on a broader scale (like Non-farm payrolls). Discover what release will influence your preferred trading instrument and monitor economic calendar for that. For example, those trading Crude Oils are affected by Petroleum status report.
Step 3. Does the weekly chart show any prominent trend?
Next step is to switch to the chart of your preferred instrument and note: is market trending or balanced? It price located outside of important extremes or is it located inside?
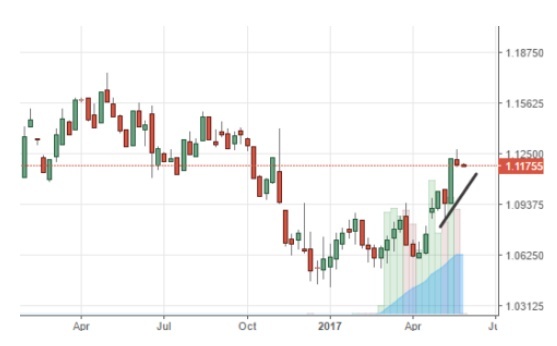
Strong trending activity may be an indication of big money involved and it’s better to take it into consideration. It doesn’t mean that you automatically would search for continuation trade if you see a strong trend, but you would think twice before accepting reversal trade. Strong trends don’t reverse very quickly.
Traders often rush to trade, but those who are patiently examining long-term trends have an edge over the rest, even in day trading.
The example of a trending market is shown below (Euro FX futures, Weekly chart*):
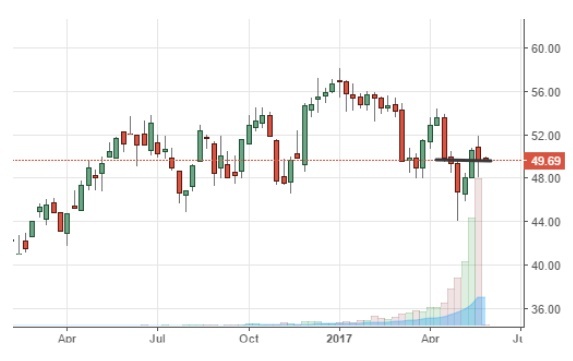
The example of a balanced market is shown below (Crude Oil futures, Weekly chart*):
Step 4. Does the daily chart show “one time-framing move”?
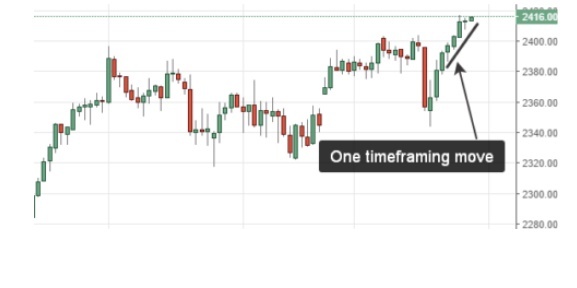
After you’ve found trending market on a weekly chart, it’s worth opening daily chart of your preferred instrument and see whether there is a sequence of at least 2-3 days with higher lows and higher highs (for ascending trend) and lower lows and lowers highs (for descending trend).
“One time-framing move” is an indication of imbalance between supply and demand that is visible right now. In case one is visible on the chart, window of opportunity is open – you may monitor for continuation trades or filter reversal trades.
Example of “one time-framing move” is shown below (E-min S&P500 future, Daily chart):*
Step 5. Is volatility of your preferred instrument high or low?
If you haven’t found any clues of a strong trend, don’t get disappointed – you still can trade on smaller time frames in short-term perspective (1-3 days).
In this case, you’d better make sure that markets which you want to trade are volatile enough. If volatility is very small, your expenses for day or short-term trading (stop-losses and spreads) would be more difficult to cover with profits (since they are limited due to limited opportunities).
Important note: in this article, we are talking about historical volatility only! There are different types of volatility in trading – we are not going to cover them all here. Just remember, that when we write “volatility”, we mean “historical volatility”.
Volatility can be measured in several ways listed below (it’s recommended to measure it on a daily chart):
With Bollinger Bands Indicator;
With the Average True Range Indicator;
With StdDev indicator;
Explanation of each indicator is beyond the scope of our article. We hope to do it in the next articles. A common way of measuring volatility is straightforward: the more value of an indicator, the more is volatility.
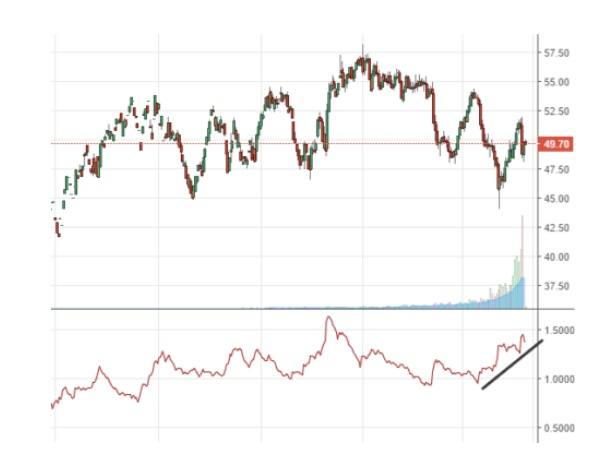
On a screenshot below you see, that volatility on the chart of CL* (Crude oil future) is going up (ATR is moving higher). Thus, this market can be traded in spite of the lack of directional (trending) component. Of course, we are talking about trading short-term swings in this case.
Step 6. Is rotational factor big/small?
The rotational factor is an ability of a price to generate “choppy” moves around current price level. The more is a rotational factor, the riskier would be day trading – your stops could be captured by the “noisy move” in this case.
The example of market phase with big rotational factor is shown below* (EURUSD, M30). You may see that choppy and manipulative market action is pretty difficult to trade. By the way – the more is a rotational factor, the fewer odds are that big time frame buyers/sellers are there – you can observer trading range on daily or weekly charts.

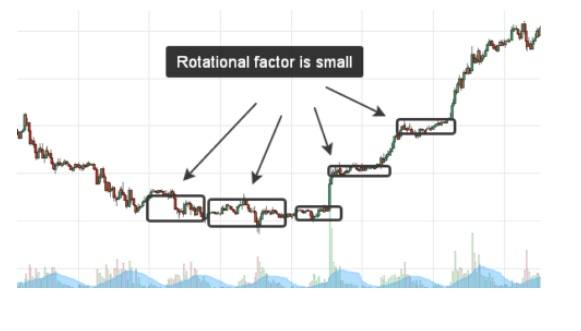
You can view the example of a small rotational factor below* (it’s EURUSD again, M30). Note that small rotational factor was the prelude for the notable breakout. In this case, intra-day volatility is smaller, thus your stops can be placed closer to the price action. In case you capture a large trending day, your profit/loss ratio may be significant:
Step 7. Combine everything together and apply points on each step.
After you completed everything, you can aggregate all pieces of information to a list and apply 1 point to each observation.
For example, if you see that market was trending on a weekly chart, you add 1 point to your list. Then, you see "one-timeframing" move on a daily chart, add 1 point again. Thus, you go through your checklist, and in case, you have many points added, you can add this market to a watch-list and start monitoring for possible entry points.
Checklist won’t tell you when to buy or to sell, it just helps you focus attention on potentially interesting markets, which contain opportunity.
Setups for entry are a completely different story.
Author

Stanislav Bernuhov
Common Sense Trading
I'm an individual trader since 2004 and a trading coach since 2010.


