Technical analysis, fundamental analysis, price action? Results Inside [Video]
![Technical analysis, fundamental analysis, price action? Results Inside [Video]](https://editorial.fxstreet.com/images/Psychology/stressed-trader-44695154.jpg)
Here is the polling results (started yesterday) from TradePrecise members regarding the method adopted for trading or investing:
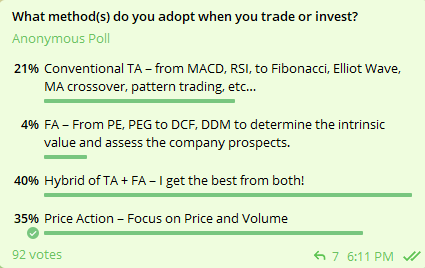
- 40% adopted the hybrid approach where they combine the technical analysis and the fundamental analysis.
- 35% focus on the price and volume, which is awesome!
- 21% prefers the conventional TA such as the indicators, MA, Fibo, pattern trading, etc…
- Only 4% are true blue investor to focus on the intrinsic value and company prospects.
Let me share with you my experiences and challenges on some of the above methods.
Black Box System
After I graduated from the University, I started “investing” in a well-known fund focused on both local and international equities because my housemate told me that his portfolio with that fund had been growing at 15–20% every year for the last 2 years.
3 years later, my portfolio with the fund had gone down by 30% due to the bear market.
I thought instead of depending on those fund managers, I should equip myself with the necessary knowledge so that I can manage and grow my hard-earned money.
After attending dozens of “free previews” of the investing/trading workshops, I was drawn by one proprietary system because of its simplicity and was definitely suitable for newbie like me to follow the signal — buy arrow and sell arrow.
In fact, I made some money for a few months with the black box system but subsequently found that it didn’t work anymore as I was losing money. I didn’t really know the reason until later — because the market environment had changed from trending to a choppy trading range.
Lesson learned: Though Black Box system could work with certain market condition; it is best to know how the system works in order to understand the limitations.
Technical Indicators
I decided to start learning the indicators from various workshops and really master some of them such as the RSI, MACD, Bollinger Band, Fibonacci, etc…
I did have some success using the indicators but again I found that most of the time my entry and exit were late. I kept adjusting the parameters so that they can “react faster” with more accuracy and eventually…
I was overwhelmed with the indicators and ended up with even more questions and frustrations.
Lesson learned: Indicators are derived from either price or/and volume hence It is normal to have lagging experience when using the indicators.
Pattern Trading
That led me to pattern trading (cup and handle, double bottom, inversed head and shoulders…) with candlesticks (bearish engulfing, hammer, morning start, island reversal, etc..). I even bought the “physical cheat sheets” so that I can always refer to without memorizing those patterns.
I was pretty good at spotting the pattern and the candlesticks and my trading results really improved. Just when I thought I found the holy grail in trading, the patterns started to fail from time to time…
Not every descending triangle went down…
Not every hammer indicated a reversal…
Despite I had no idea why the patterns or candlestick failed, I could survive using the risk management, yet I kept wondering there must be a missing piece.
Lesson learned: More works are needed to crack the code for pattern trading and candlesticks and risk management is key when dealing with bad trades or failures.
Value Investing
While searching for the missing piece for pattern trading, I further enhanced myself with value investing. I picked up the knowledge on interpreting the profit & loss statement, balance sheet and cash flow statement to spot the red flags, using discounted cash flow (DCF) to derive the intrinsic value, etc…
I also put a lot of focus on the future prospects of the companies, followed every single piece of news regarding new project, contracts, potential JV, new plant, etc…
I had quite a number of the profitable trades by combining the TA with the FA, mostly for the up trending stocks where the news driven catalysts just spiked the share price higher.
The theory of value/growth investing makes perfect sense…
Until it clashed with my technical analysis.
Some companies are always “undervalued” and cash rich while the stock prices are stuck in a trading range for years without much volume.
Some of the potential “growth companies” had a great turnaround story supported by huge JV projects with great upside potential. Yet their share price has been trending down.
The worst part was I removed my stop loss when I was in a losing position because I “think” the future prospects of the stocks are just too good to miss out.
Some of those losing trades turned out a big hit!
Lesson learned: Always have a plan (including the entry, exit and % of risk taken) and stick to it. Risk management is the key when it comes to investing or trading. Do not let a small percentage of your trades ruin your whole account. The market is always there and you are welcomed to get in anytime. There is a huge difference between “value investing” and get “hooked on” a growth story.
I will elaborate more on the missing piece for trading and investing tomorrow.
Meanwhile, watch the video below to find out how I use the missing piece to identify market leaders with huge upside ahead.
Author

Ming Jong Tey
Independent Analyst
Ming Jong Tey has been trading since 2008. He started his learning journey from technical analysis (indicators, Fibonacci, etc...) to value investing. Throughout his journey, he develops an interest in price action with chart pattern trading.


