![]() Brandon Wendell, CMT
Brandon Wendell, CMT
Brandon Wendell
The first half hour to hour of the equity markets can be very volatile. Sometimes it seems like prices are fluctuating wildly with no rhyme or reason. However, there is a technique that could help you predict the morning price movement and even potential price reversals. This technique could be used for finding highly successful intraday trade opportunities.
Futures trade with high leverage in comparison to the stocks making up the indexes. Buying 100 shares of the SPY (the ETF that tracks the S&P 500 index) would cost nearly $29,200 at the time of this writing. Even with 2:1 margin, a trader would need $14,600 to maintain the position. To trade one contract of the ES (the S&P 500 eMini future), a trader only needs $6930. For an intraday trade, the margin could be as low as $500!
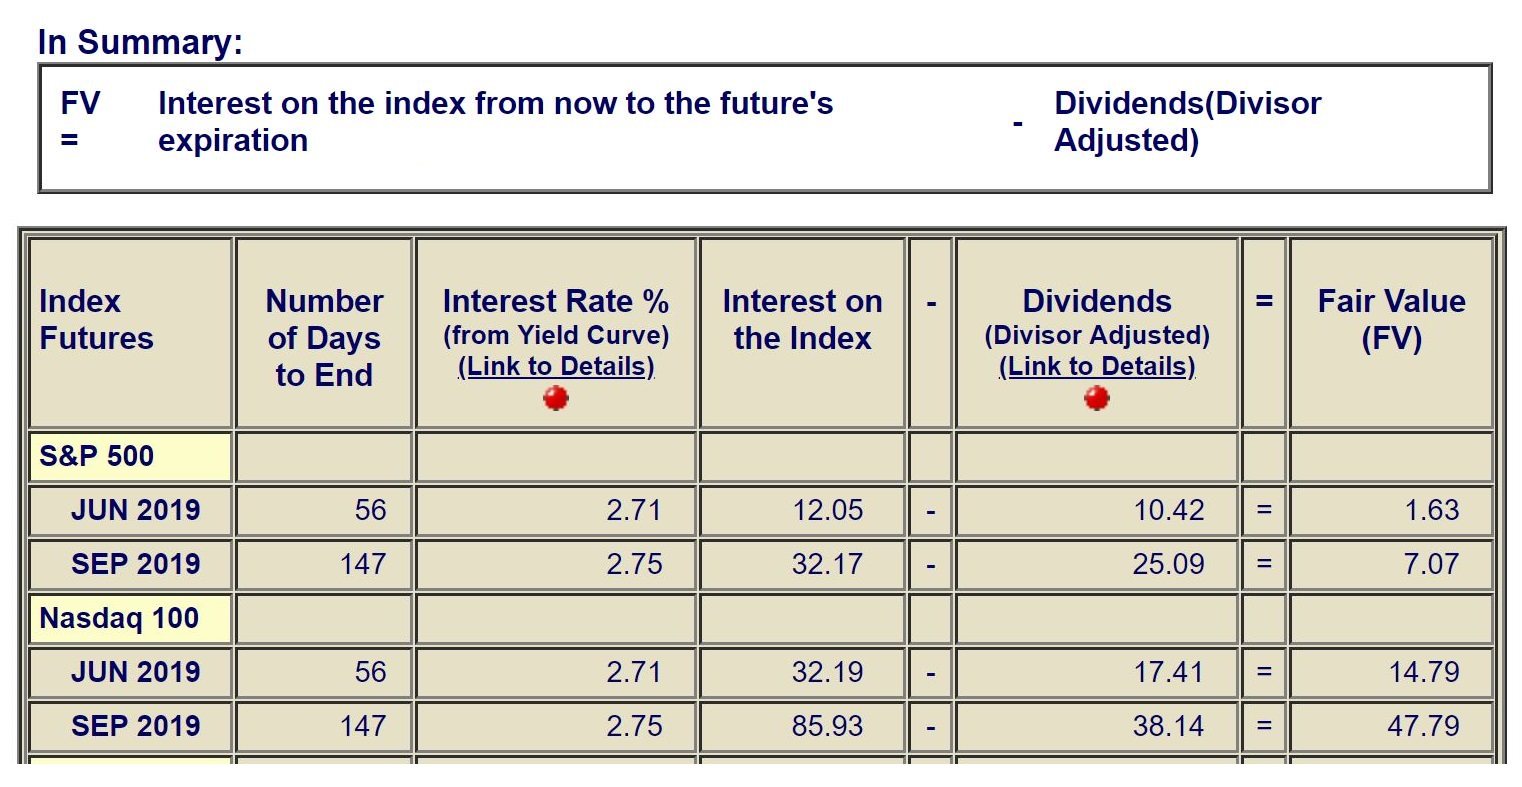
Take note that the price of the futures is not the same as the index. This is done on purpose. Buying index futures can be done to participate in the broad market without having to buy all of the stocks individually. Since a trader can put down smaller margin and trade futures in lieu of stocks, they could theoretically earn interest on the money that they are not using had they bought the stock. The futures exchanges attach a fair value to the future’s pricing in order to make them priced similarly to the equivalent index. A futures trader will not receive dividends as would the stock or ETF trader. That dividend value must be subtracted from the interest added to arrive at the fair value.
Futures Fair Value = Interest available on the future contract until expiration minus the dividends to be paid on the stocks until the expiration.
The fair value only changes once a day when the equity market closes. That is when a stock would go ex-div and pay out a dividend and also when there is one less day of interest until expiration. There are plenty of sites that show you the fair value number. I tend to check www.indexarb.com to get the data.
Due to the market forces of supply and demand and price movement, the relationship between the index futures and the indexes themselves will change. While there is a fair value assigned to the futures, they may not be trading at that value from time to time.
There are a group of institutional traders called program traders who have their computers set to recognize mispricing between the S&P 500 Index and the S&P 500 Futures. When the mispricing occurs, they buy the undervalued security (or the stocks making up the index) and sell the overvalued one. This is known as an arbitrage opportunity.
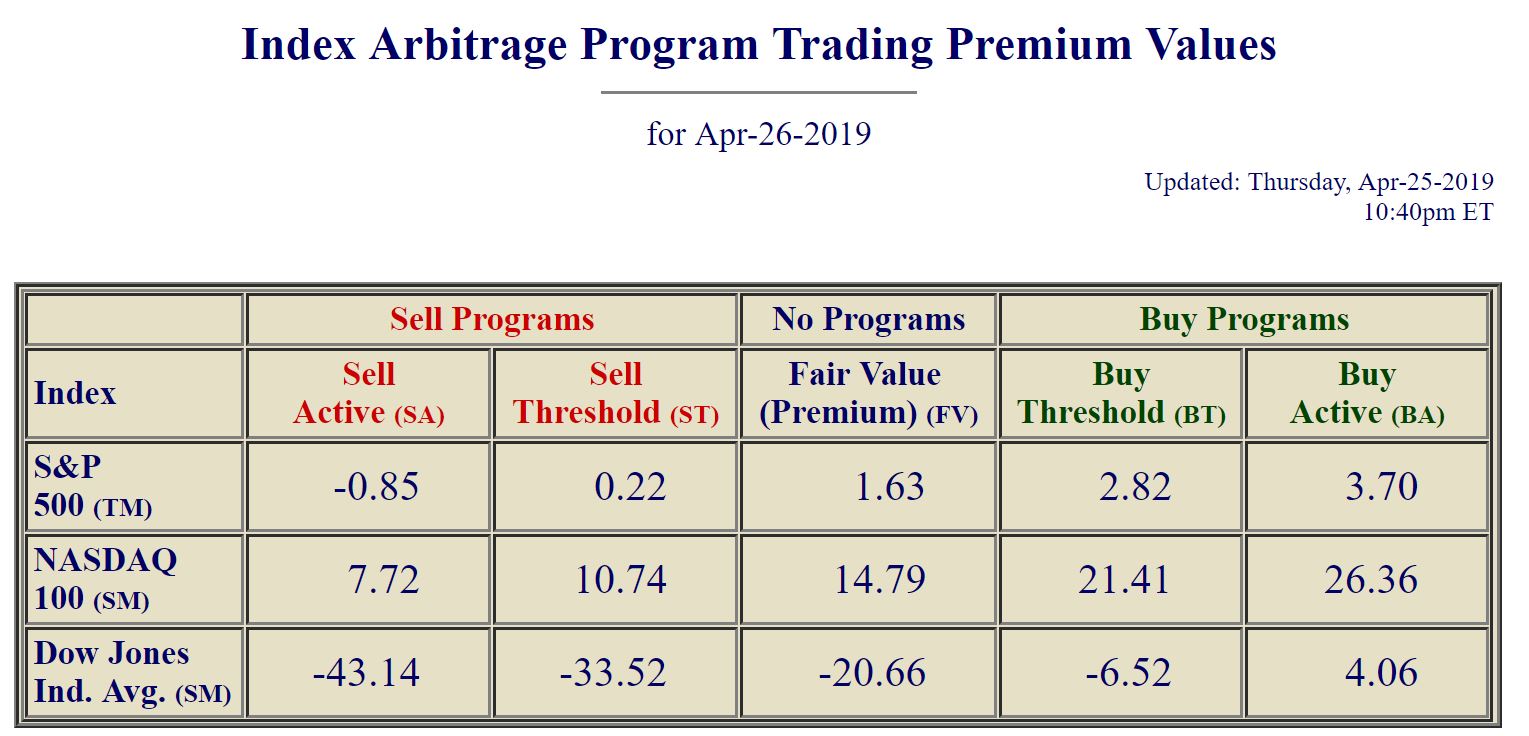
As you can see from the fair value, the S&P Futures should be trading 1.63 points below the S&P 500 Index for the entire day. The buy and sell thresholds tell the program traders when the two are mispriced and ready for an arbitrage opportunity.
Looking at the picture above, we can see the buy and sell thresholds with the fair values. Should the difference between the S&P 500 futures and the S&P 500 index become greater than 2.82, some of the program traders will buy the undervalued stocks in the S&P 500 and sell the S&P futures to bring the two back in line. If a larger move on the futures pushes the price above what the index is trading at by more than 3.70, then all the programs traders should act and a sharp movement in the markets would result.
The opposite would occur should the difference between the S&P index and the futures become too great on the downside. If the price gap between the two becomes smaller than 0.22, then some program traders will buy the futures and sell most of the stocks making up the S&P 500 index. If the price of the futures drops more than 0.85 below the price of the index, then all the program traders should move in and buy futures and short the stocks. This will result in a larger move in both the index and the futures.
In TradeStation, you can chart the price difference between the S&P 500 index and the S&P 500 futures. This is called the premium and the symbol is $SPINX. If we look at the following chart of the premium along with the program trading buy and sell thresholds drawn on the chart, we can identify the times when these programs will move the markets.
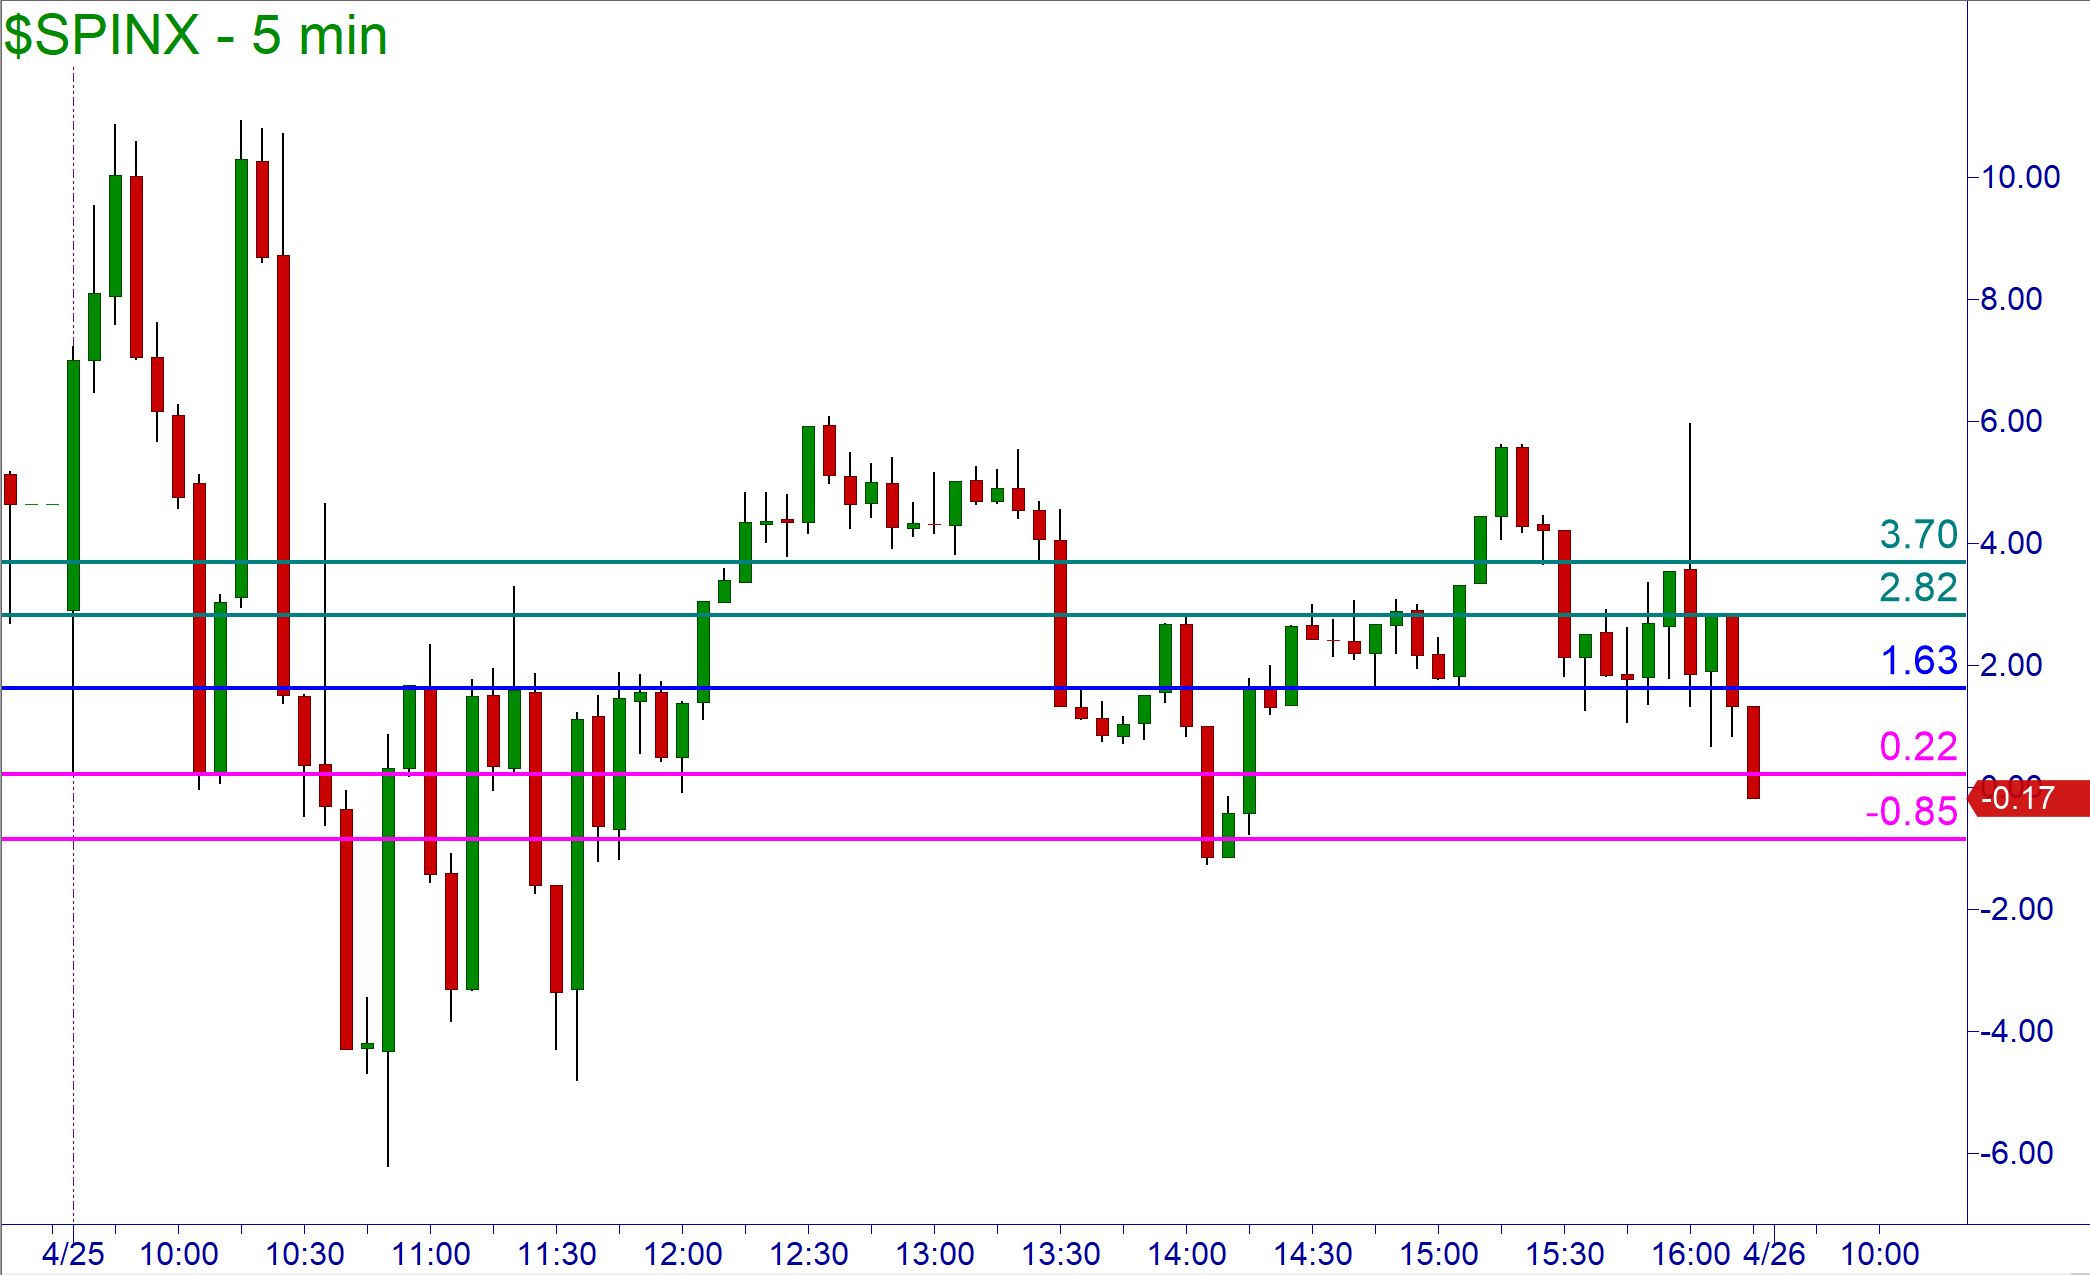
You can see that within the first hour of the market opening, the premium spiked too high two times. Since the premium was too high the program traders acted and caused a rally in the equity market until the premium was near the 1.63 target. This gave a knowledgeable trader an excellent buying opportunity on SPY or even the individual stocks that follow the market.
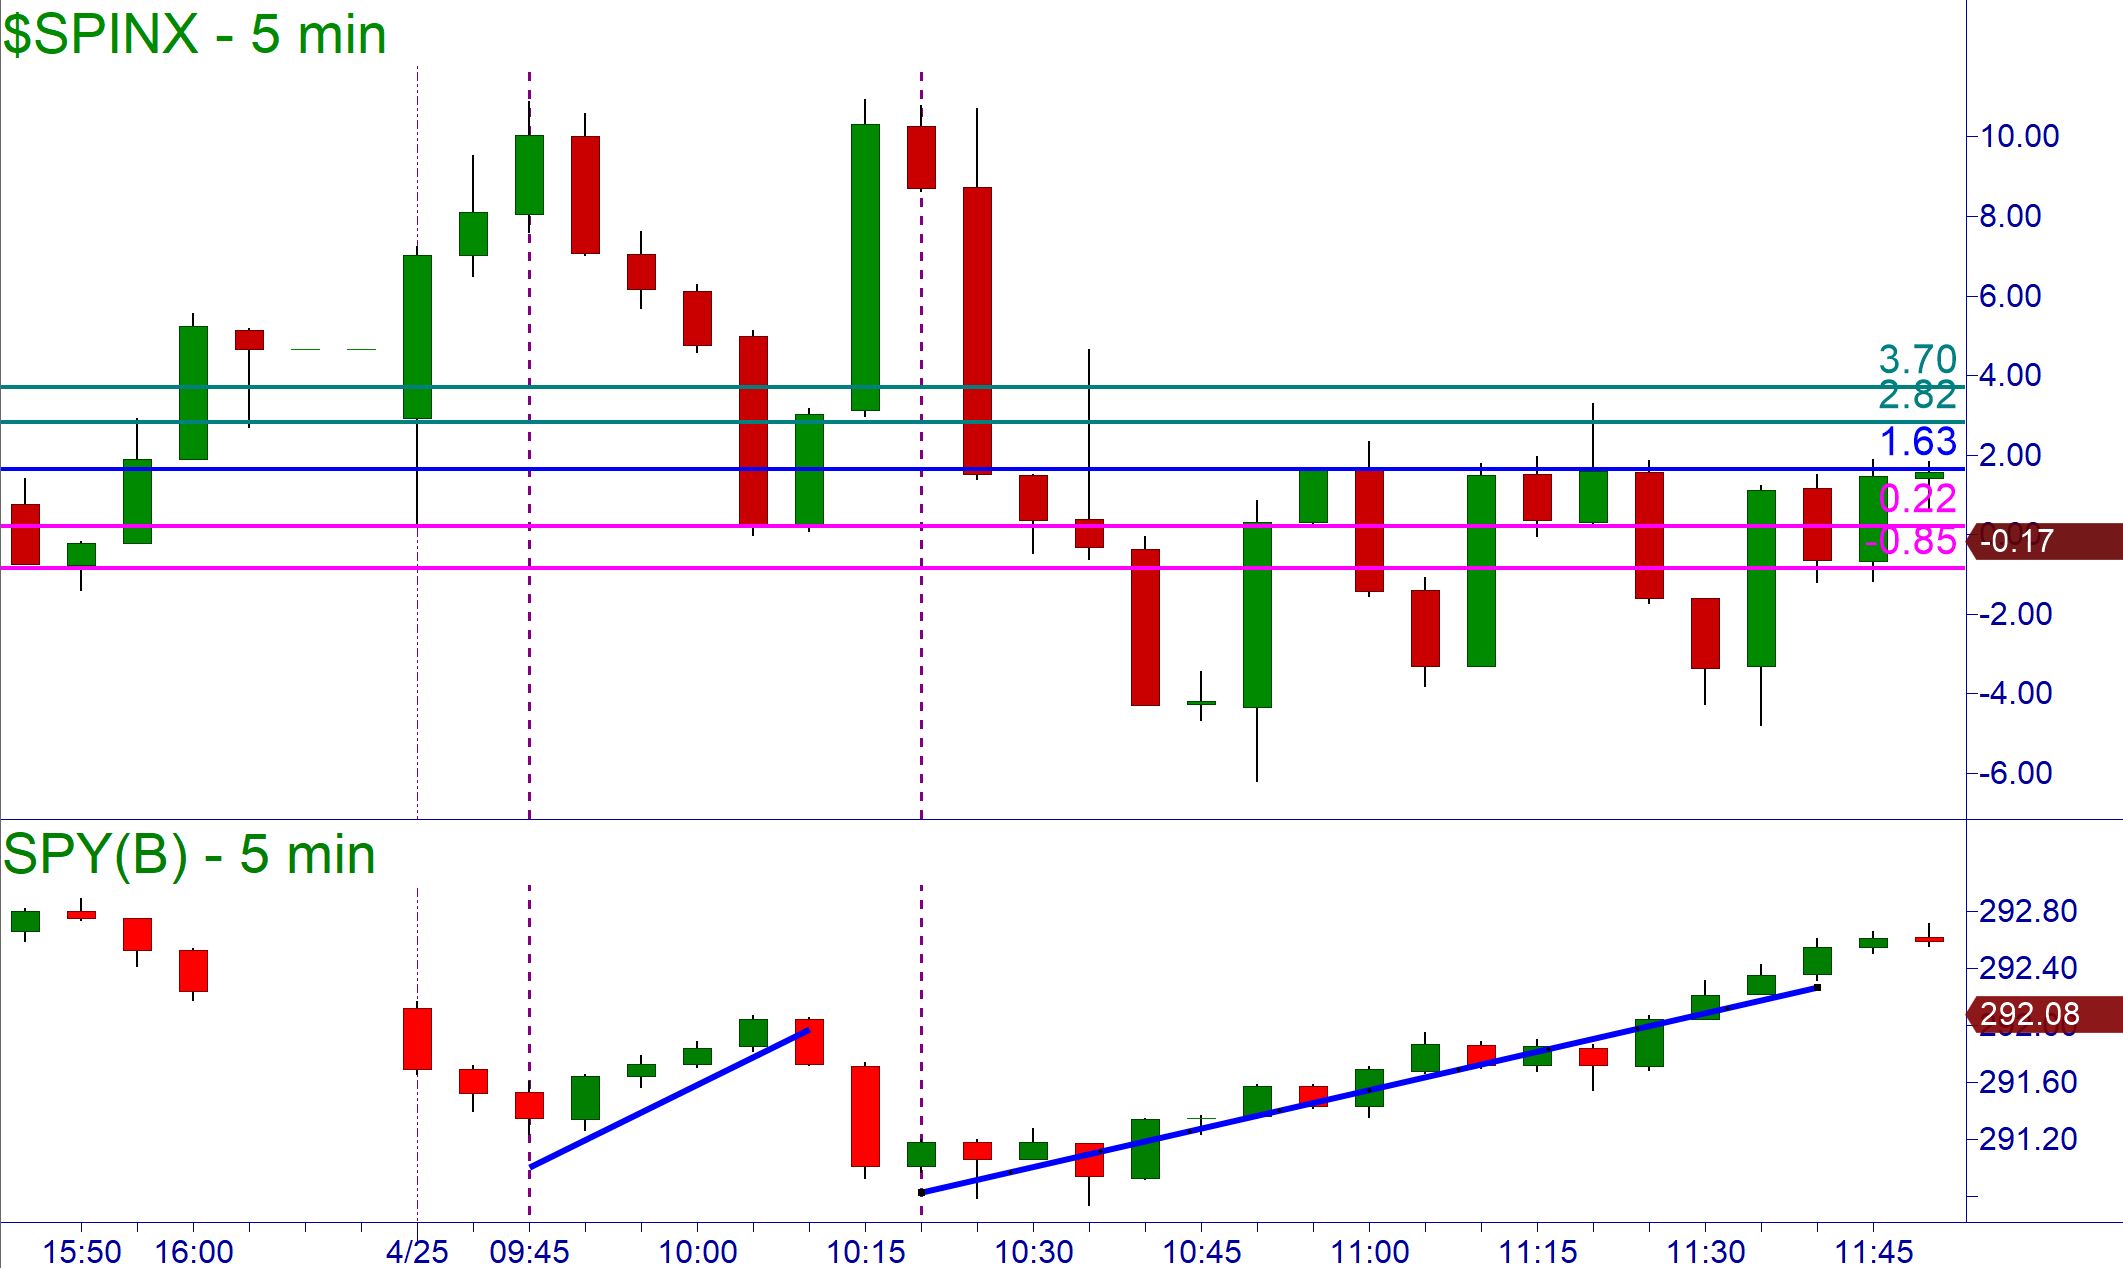
On any given day, when you are watching your stock or the SPY approaching a supply zone and are trying to decide whether you should sell or short the level, look at what the premium is doing. If it is approaching the lower levels or sell thresholds, then you should have more confidence that the level will hold. If you are looking at a demand zone on your stock and the premium is moving up to or beyond the buy threshold, you should have a higher confidence of the demand zone working.
I decided to take it one step further and placed a Bollinger Band set to 20 periods and an exponential moving average on the premium chart. I noticed that when the band was pierced, it often corresponded with an immediate change of trend direction in the SPY ETF.
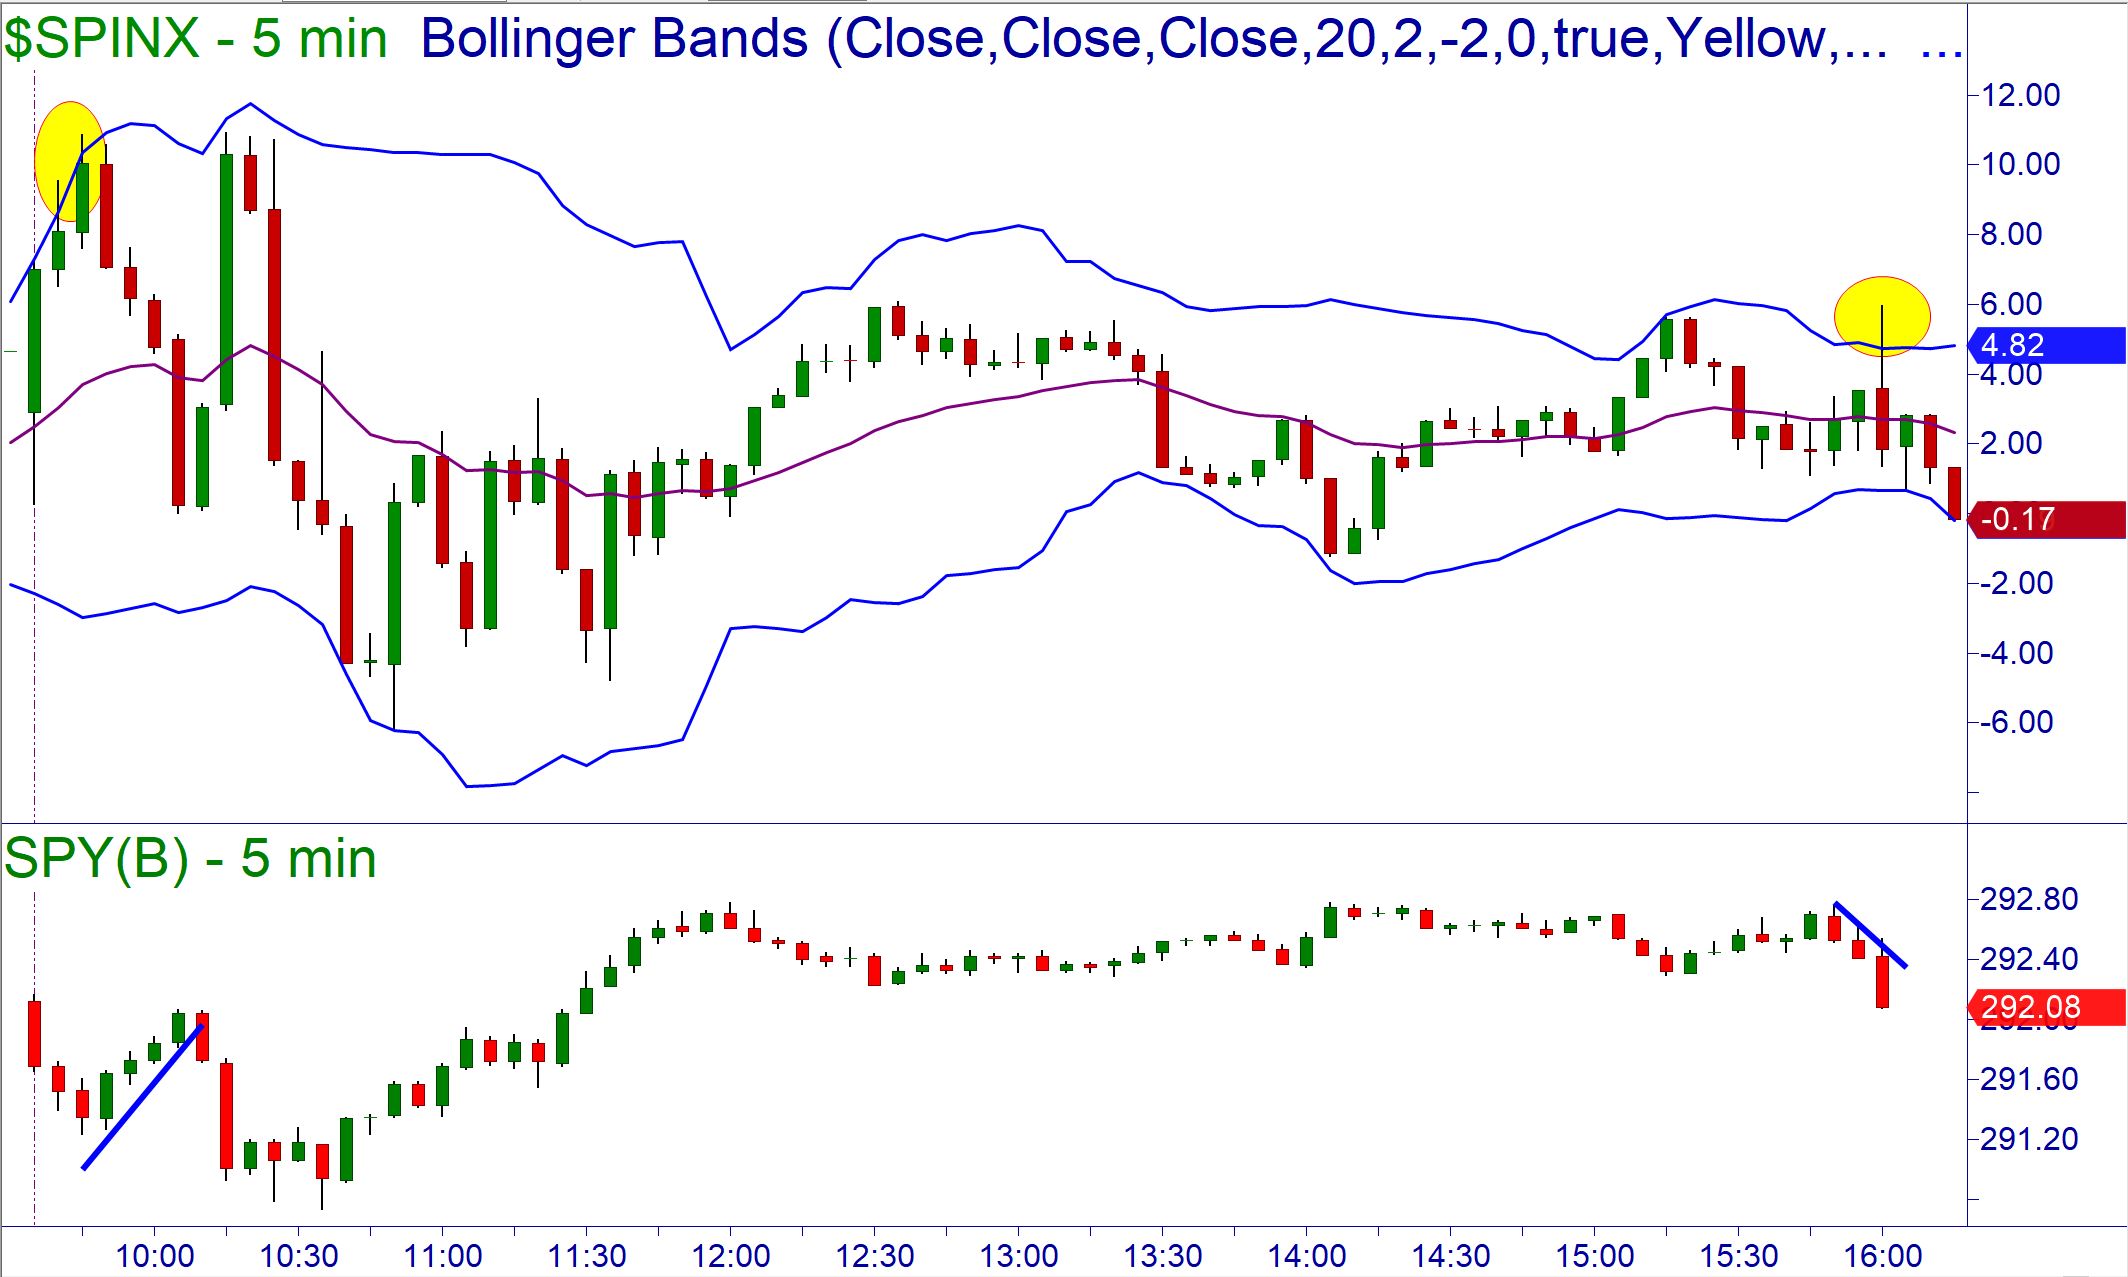
We must not forget that we need to make our trading decisions on Online Trading Academy’s Core Strategy of supply, demand, and trend. So, while the premium chart with Bollinger Bands is not the holy grail of technical analysis, it is something that a trader can use as a decision support tool.
Read the original article here - Program Traders and the Market Open
Neither Freedom Management Partners nor any of its personnel are registered broker-dealers or investment advisers. I will mention that I consider certain securities or positions to be good candidates for the types of strategies we are discussing or illustrating. Because I consider the securities or positions appropriate to the discussion or for illustration purposes does not mean that I am telling you to trade the strategies or securities. Keep in mind that we are not providing you with recommendations or personalized advice about your trading activities. The information we are providing is not tailored to any individual. Any mention of a particular security is not a recommendation to buy, sell, or hold that or any other security or a suggestion that it is suitable for any specific person. Keep in mind that all trading involves a risk of loss, and this will always be the situation, regardless of whether we are discussing strategies that are intended to limit risk. Also, Freedom Management Partners’ personnel are not subject to trading restrictions. I and others at Freedom Management Partners could have a position in a security or initiate a position in a security at any time.
Editors’ Picks

EUR/USD hits two-day highs near 1.1820
EUR/USD picks up pace and reaches two-day tops around 1.1820 at the end of the week. The pair’s move higher comes on the back of renewed weakness in the US Dollar amid growing talk that the Fed could deliver an interest rate cut as early as March. On the docket, the flash US Consumer Sentiment improves to 57.3 in February.

GBP/USD reclaims 1.3600 and above
GBP/USD reverses two straight days of losses, surpassing the key 1.3600 yardstick on Friday. Cable’s rebound comes as the Greenback slips away from two-week highs in response to some profit-taking mood and speculation of Fed rate cuts. In addition, hawkish comments from the BoE’s Pill are also collaborating with the quid’s improvement.

USD/JPY drops back below 157.00, as focus shifts to Japan snap election
USD/JPY is back in the red below 157.00 in the Asian session on Friday. The Japanese Yen recovers ground against the US Dollar amid some profit-taking ahead of Japan's snap general election on Sunday. The preliminary reading of the Michigan Consumer Sentiment Index report for February will be released later on Friday.
Editors’ Picks

EUR/USD: US Dollar to remain pressured until uncertainty fog dissipates Premium
The EUR/USD pair lost additional ground in the first week of February, settling at around 1.1820. The reversal lost momentum after the pair peaked at 1.2082 in January, its highest since mid-2021.

Gold: Volatility persists in commodity space Premium
After losing more than 8% to end the previous week, Gold (XAU/USD) remained under heavy selling pressure on Monday and dropped toward $4,400. Although XAU/USD staged a decisive rebound afterward, it failed to stabilize above $5,000.

GBP/USD: Pound Sterling tests key support ahead of a big week Premium
The Pound Sterling (GBP) changed course against the US Dollar (USD), with GBP/USD giving up nearly 200 pips in a dramatic correction.

Bitcoin: The worst may be behind us
Bitcoin (BTC) price recovers slightly, trading at $65,000 at the time of writing on Friday, after reaching a low of $60,000 during the early Asian trading session. The Crypto King remained under pressure so far this week, posting three consecutive weeks of losses exceeding 30%.

Three scenarios for Japanese Yen ahead of snap election Premium
The latest polls point to a dominant win for the ruling bloc at the upcoming Japanese snap election. The larger Sanae Takaichi’s mandate, the more investors fear faster implementation of tax cuts and spending plans.
RECOMMENDED LESSONS
Making money in forex is easy if you know how the bankers trade!
I’m often mystified in my educational forex articles why so many traders struggle to make consistent money out of forex trading. The answer has more to do with what they don’t know than what they do know. After working in investment banks for 20 years many of which were as a Chief trader its second knowledge how to extract cash out of the market.
5 Forex News Events You Need To Know
In the fast moving world of currency markets where huge moves can seemingly come from nowhere, it is extremely important for new traders to learn about the various economic indicators and forex news events and releases that shape the markets. Indeed, quickly getting a handle on which data to look out for, what it means, and how to trade it can see new traders quickly become far more profitable and sets up the road to long term success.
Top 10 Chart Patterns Every Trader Should Know
Chart patterns are one of the most effective trading tools for a trader. They are pure price-action, and form on the basis of underlying buying and selling pressure. Chart patterns have a proven track-record, and traders use them to identify continuation or reversal signals, to open positions and identify price targets.
7 Ways to Avoid Forex Scams
The forex industry is recently seeing more and more scams. Here are 7 ways to avoid losing your money in such scams: Forex scams are becoming frequent. Michael Greenberg reports on luxurious expenses, including a submarine bought from the money taken from forex traders. Here’s another report of a forex fraud. So, how can we avoid falling in such forex scams?
What Are the 10 Fatal Mistakes Traders Make
Trading is exciting. Trading is hard. Trading is extremely hard. Some say that it takes more than 10,000 hours to master. Others believe that trading is the way to quick riches. They might be both wrong. What is important to know that no matter how experienced you are, mistakes will be part of the trading process.
The challenge: Timing the market and trader psychology
Successful trading often comes down to timing – entering and exiting trades at the right moments. Yet timing the market is notoriously difficult, largely because human psychology can derail even the best plans. Two powerful emotions in particular – fear and greed – tend to drive trading decisions off course.