How To Use Fibonacci Retracement & Expansion

The use of Fibonacci levels in trading is perhaps one the best examples of the core philosophy of Technical Analysis and the belief of many, that trading decisions can be made purely from studying the charts and without the need for Fundamental Analysis.
Without giving you a history lesson on Fibonacci and his importance in mathematics we will focus solely on how Fibonacci levels are used in trading.
Fibonacci numbers, when used to measure price swings in the markets, present powerful levels to watch for potential reversals and are applied in technical analysis through two main studies: Fibonacci retracement and Fibonacci expansion.
Fibonacci Retracement
The retracement tool is used to measure a move in price and identify areas to look for price to retrace into with a view to reversing and continuing in the direction of the primary move and is a popular method amongst trend-traders looking to enter on a pullback to trade a resumption of the trend.
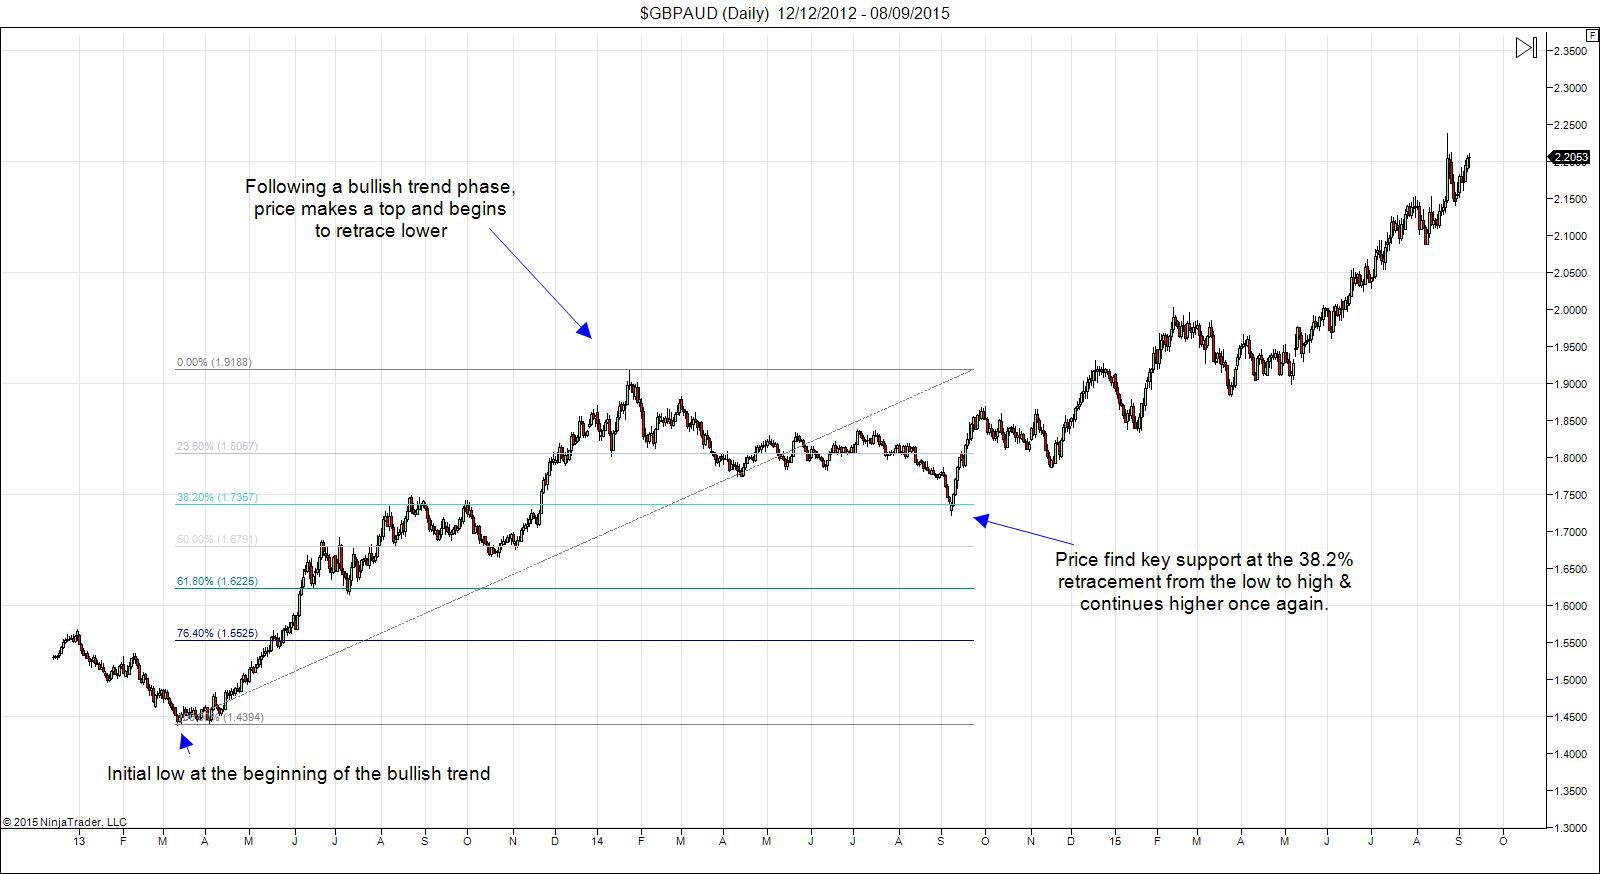
In the example above we can see that GBPAUD enjoyed a sustained bullish trend before it began to retrace and move lower (known as a correction). Applying a Fibonacci retracement tool from the low to the initial high point, we can see that price sold off 38.2% of its gains before reversing and resuming the bullish trend.
Why is is that Fibonacci levels work?
Some argue that it is due to the core mathematical principles underpinning Fibonacci numbers and their relation to the natural geometrical structures found throughout nature, whilst others argue it is simply due to crowd mentality and the fact that as so many traders watch these levels and anticipate their response, they have become a kind of “self-fulfilling prophecy”.
So which is true? well, probably a bit of both, but the important point is that we don’t need to know for certain why it is they work just that they tend to.
A key consideration here is that we can never know for certain which Fibonacci level will yield a reversal, or indeed if any will, but they are powerful levels to identify and monitor because of how often they tend to work. It is certainly not advisable to simply trade the level expecting a reversal but where we can find Fibonacci levels that line up around key structural points, such as support/resistance formed from previous highs and lows, this increases the chance of the level holding.
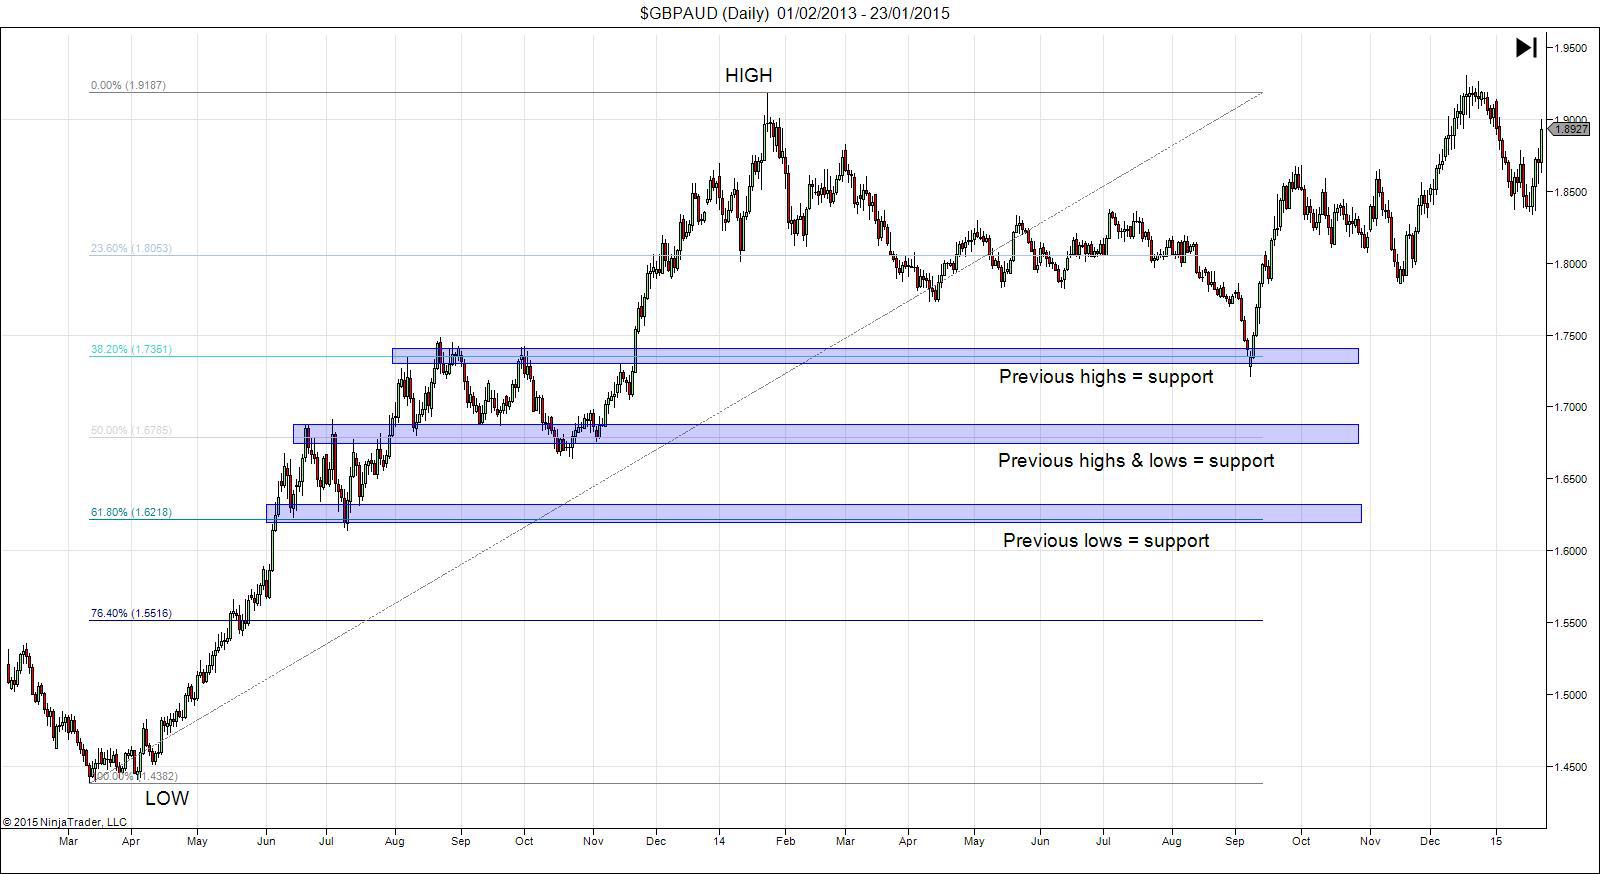
Looking at the above example again we can see that the 38.2% retracement lined up with former broken highs offering strong support. The 50% & 61.8% retracement levels also lined up with key structural levels.
Another way to find levels with an increased likelihood of holding is to find technical confluence such as looking to identify indicator divergence into key Fibonacci levels or identifying price action patterns that suggest a reversal.
A really simple way to identify confluence is simply to use the Fibonacci tool to itself and measure different swings to find levels that coincide as these tend to be the most powerful.
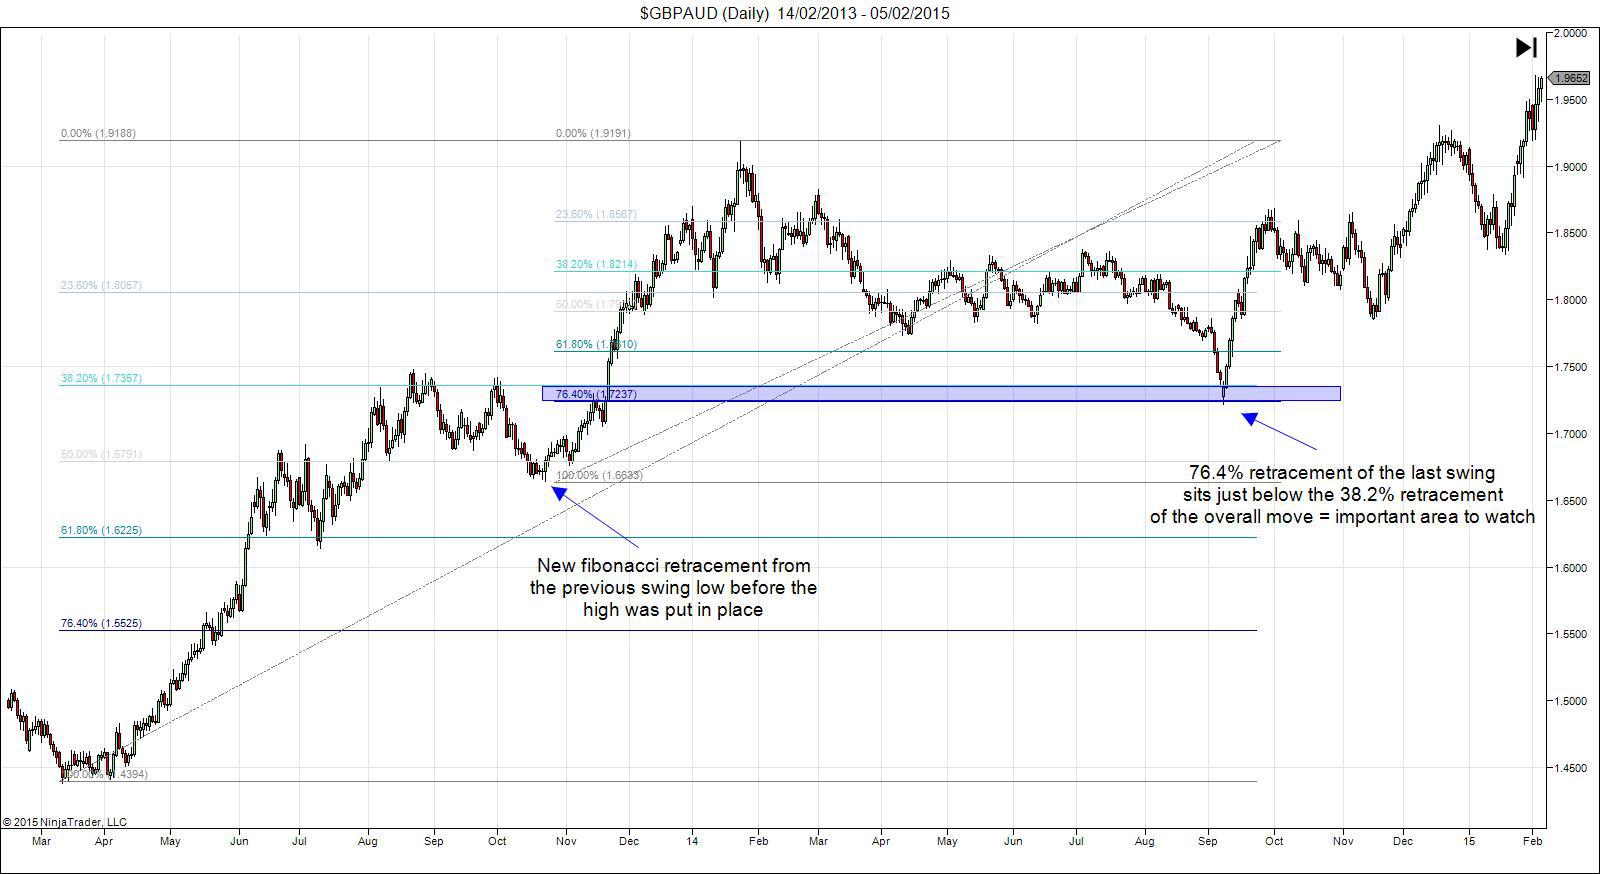
In the example above we can see that if we use the Fibonacci retracement tool to measure the last swing made into the high, the 78.4% retracement sits just below the 38.2% retracement of the overall move creating a powerful zone to watch for potential reversals.
Using this method of measuring various swing points to find confluence of Fibonacci retracement levels is a really great way to identify potential trade zones.
They key Fibonacci retracement levels to monitor are
0%
23.6%
38.2%
50%
61.8%
76.4%
100%
Fibonacci Expansion
Whereas Fibonacci retracement measures a move to find levels to look for price to retrace into, Fibonacci expansion measures a move to project levels in the direction of the primary move that price is likely to move into in future.
The Fibonacci extension tool has 3 points instead of 2. Using the bullish example from above we measure first from low to high and then also to retracement low.
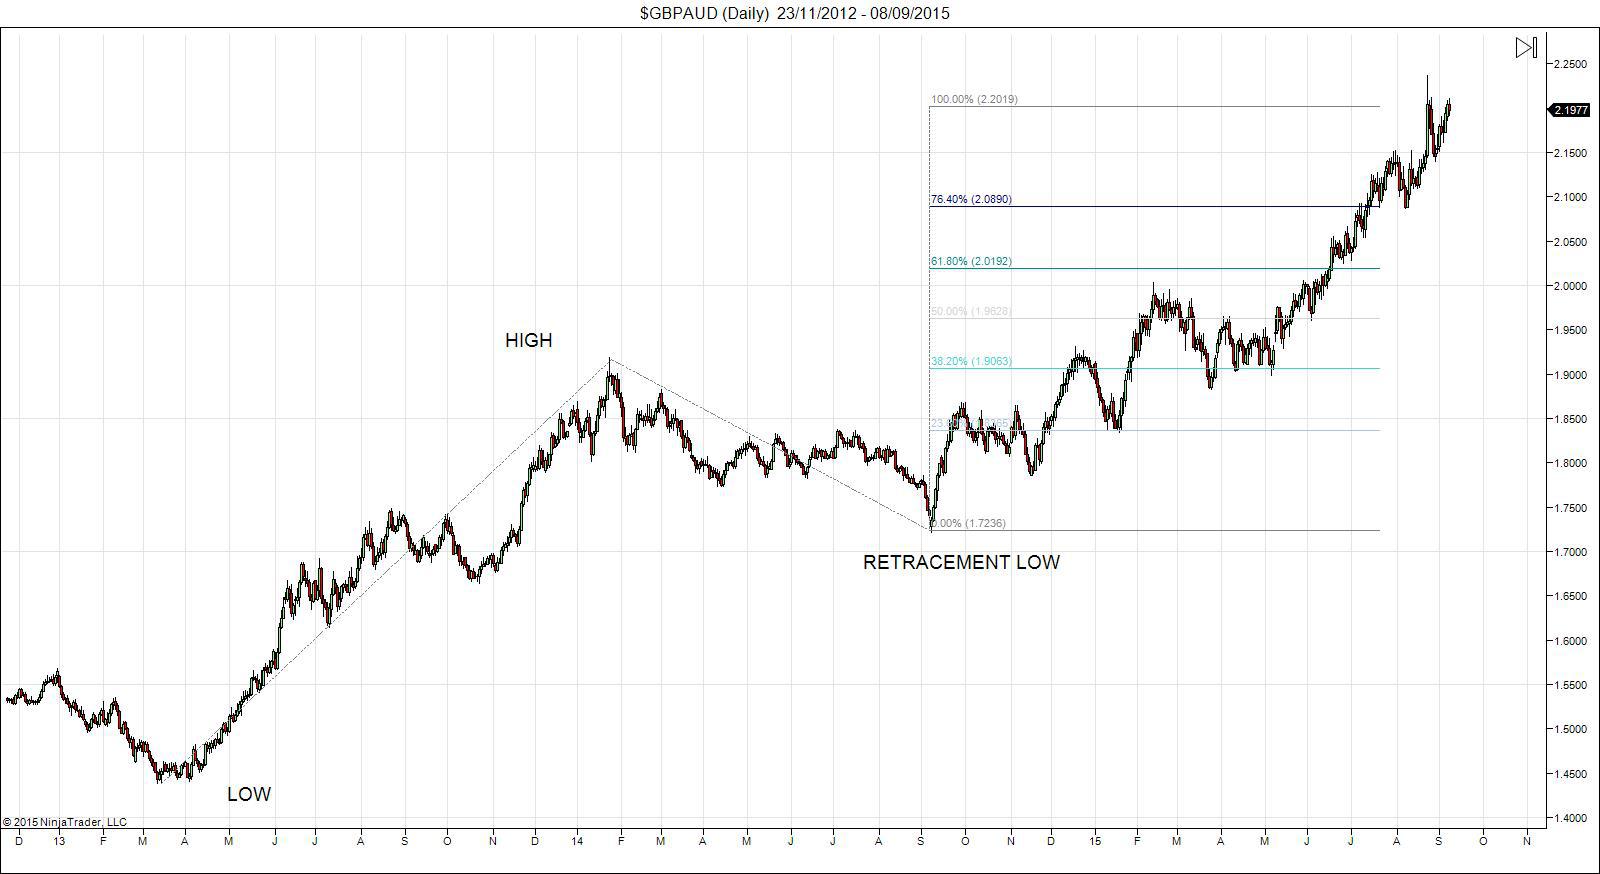
In the above example we can see the Fibonacci expansion levels marked on the chart from applying the tool to the high, low and retracement low. Price has already hit these levels but at the the time that price was moving up from the retracement low these would have been fresh levels in the market (future levels) that we would monitor.
So how do you use Fibonacci expansion levels?
Well if we were trading that bullish trend for example and had entered on the retracement to the 38.2% level, we could monitor these levels as potential take-profit targets again looking for indicator or price action divergence to suggest the level we should take profit at.
The most important expansion level is the 100% which tends to offer the strongest reaction.
Again however we can use the Fibonacci tools themselves to identify confluence. This time we can use a combination of retracement and expansion to identify key levels.
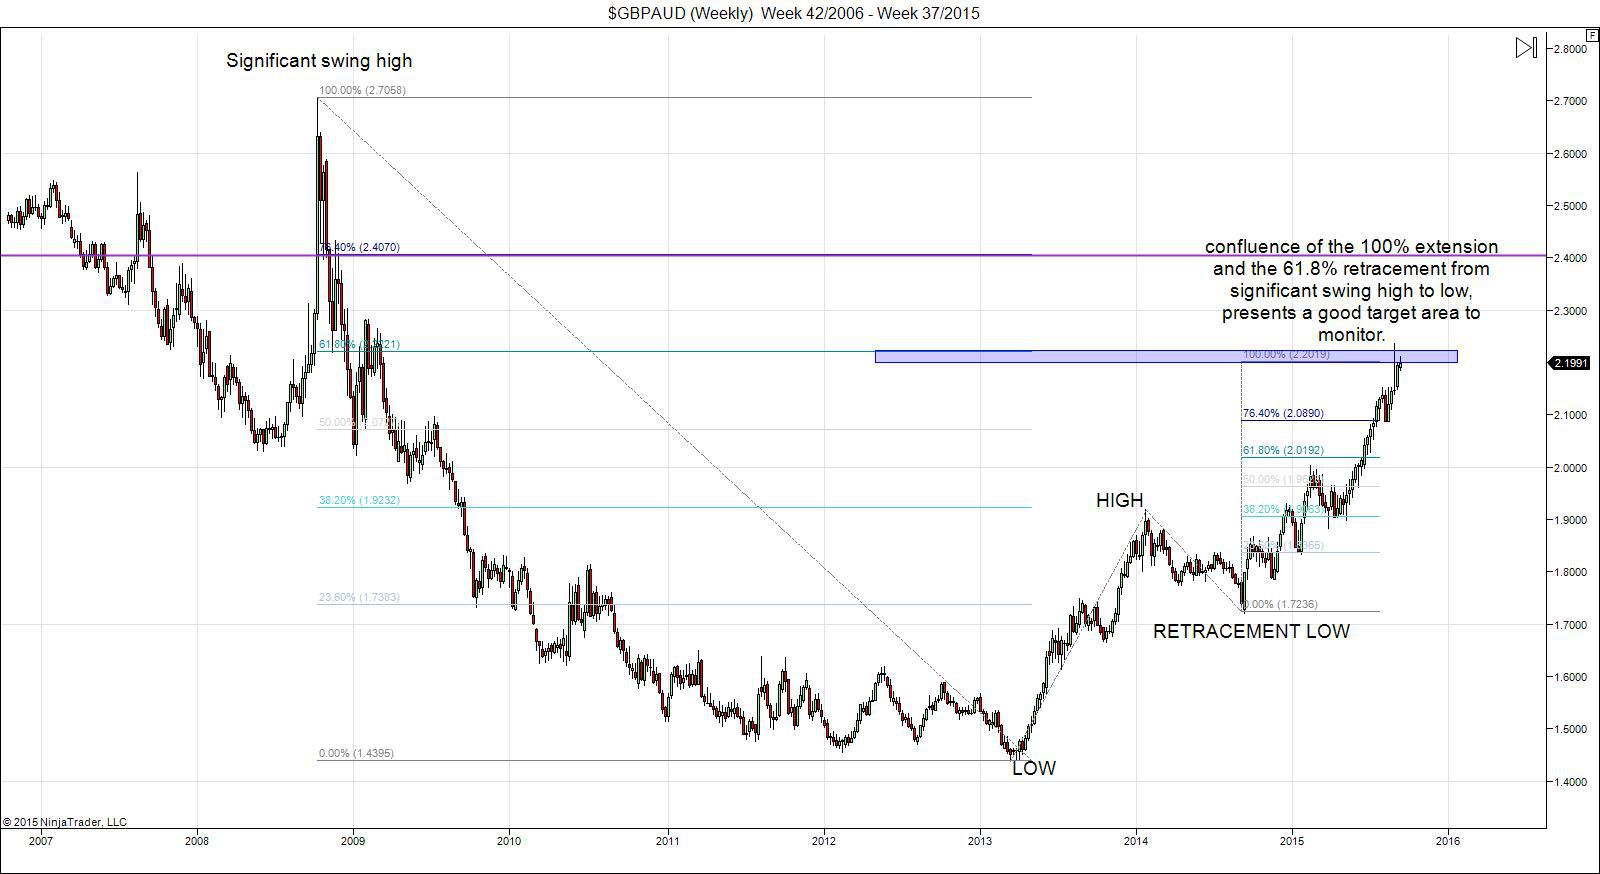
In the example above we can see that if we zoom out on our chart and look to find the last significant swing high point before the low was made at the start of the bullish trend we are in, we can apply our retracement tool.
The 61.8% retracement from that significant high sits nicely with the 100% expansion level of our primary bullish move and as such would be a great area to monitor as a potential target.
Hopefully the examples and explanations above have opened your eyes to the power of Fibonacci levels in trading. As with all technical analysis it is simply a question of getting used to the methods and becoming more competent and confident with them. Make sure you only stick to significant swing points and begin on the Daily & Weekly charts to start with. If you have to ask yourself “is this a significant swing point?” then it probably isn’t – just stick to the obvious ones to start with.
Once you start to combine some price action analysis or combine indicators with these Fibonacci levels you can create some really profitable trading opportunities.
Author

James Harte, IMC
Orbex
James Harte is a Market Analyst and Content Author at Orbex with over eight years’ experience in analysing and trading currency markets.


