Bullish Engulfing and Bearish Engulfing- Probably The Best Price Action Candlestick Patterns

This article will be divided into two parts- first part will deal with the bullish engulfing pattern; the second part will go over the bearish engulfing candlestick pattern. History repeats itself, so I believe that the best way to read the market is to know what happened in the past. Bullish engulfing patterns are a confirmation that more buyers want to join the uptrend. On the other side, a bearish engulfing pattern gives confirmation for more sellers joining the short side. Let’s move to the first part- the bullish engulfing candlestick pattern.
PART 1– Bullish Engulfing Candlestick and Price Action
What is a candlestick
Before I move to the real part, I would like to remind you once again what is a candlestick.
A candlestick contains an instrument’s value at open, high, low and close of a specific time interval.
Let’s say we are looking at a daily candlestick. It does contain the value at open, high, low and close on any particular day.
A candle is formed by two parts:
1) Body
2) Tail (a.k.a wick or shadow).
The “Body” represents the range between the open and the close for the particular time interval.
The “Tails” represent the highest and lowest values achieved for that particular time interval.
There are various types of candles and one of the most famous ones is the bullish engulfing and bearish engulfing candlestick patterns. Let’s start by first exploring the bullish engulfing candlestick pattern.
Bullish Engulfing Candlestick
What is a bullish engulfing candle?
Let’s start by introducing the candlestick pattern with an image of a perfect bullish engulfing pattern:
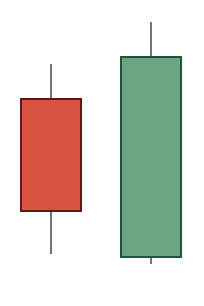
The image above is showing a perfect bullish engulfing pattern. What does it represent?
A bullish engulfing candlestick formation represents that bulls are in full control of bears. As the pattern above shows, the green body (bulls) covers completely the red-bodied candle (bears). This shows the readiness of the market participants to drive a particular instrument’s price higher.
What about the shadows (tails)?
A lot of you are already asking what happens with the tails. Why are they there? Do we include them in our analysis?
These are great questions, which require more attention than is currently given to them. In a perfect scenario like the one above, a bullish engulfing pattern should include the shadows of the candles. A real bullish engulfing pattern forms when the green body of the second candle fully engulfs the whole previous candle including the tails.
Here the opinions diverge into two schools. The one is preaching that the best bullish engulfing pattern forms when both the body and the tails are engulfed.
The second school believes that for a bullish engulfing pattern it does not really matter if the tails are engulfed or not. What matters is only the real body of the candle.
My opinion
My personal attitude towards the bullish engulfing pattern is that the real body is the most important element. It is great if tails are engulfed, but it is not the end of the world if they are not.
The bullish engulfing candlestick pattern below is an example of what I mean:
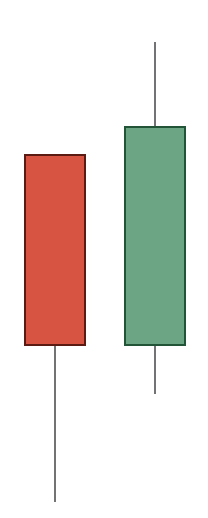
That is a great example of a bullish engulfing pattern I would have considered as valid. As you can see the red body of the first candle is fully engulfed by the second green candle.
The lower tail of the red candle is not engulfed by the green candle, but for me that is not as important. What matters is the real body of the candle. As long as it is fully engulfed, I would classify this pattern as a bullish engulfing.
Why tails are not so important?
A very good question is if why tails (or the upper and lower shadows) not so important.
I would say that they are important for two reasons- no more or less than that.
The first reason of why they are important is that they show what is the maximum and minimum readiness of market participants to pay for a particular instrument. That is the highest and lowest value that was reached for a particular market session.
The second reason why tails are important is to give us an indication of where to place stop-losses and potential targets.
Don’t get me wrong- tails are extremely important. But they are not as important as to validate the bullish engulfing pattern.
What does a bullish engulfing pattern mean
So, what stands behind the bullish engulfing candlestick pattern. As most of you are already familiar
with is that I am a price action trader. I read the tape and do what the market dictates.
A bullish engulfing pattern is just a confirmation of what the market participants agree on.
When a bullish engulfing pattern forms, market participants agree that price can go higher.
In other words, more market participants are willing to buy than to sell that particular instrument. That is an indication for price action traders that more buyers will join the trend and it will be extended to new highs.
A bullish engulfing pattern is like a wall of bricks. That association has always helped me better visualise the way this pattern works. The more bricks you add to the wall, the more solid it becomes. Just like an uptrend…
Variations of the bullish engulfing pattern
There are many variations of the bullish engulfing pattern. One thing to remember is to learn how to read the pattern. You need to understand that if you have a red body and then a series of green-bodied candles, we might still have a bullish engulfing pattern.
What matters is to have the green bodies engulfing the red body of the previous candle. Have a look at the example below:

The image above shows a two-bodied bullish engulfing pattern.
Important: It does not matter how many candles you have forming a bullish engulfing candlestick pattern. What matters is that the body of the red candle is fully engulfed.
Below is given another example of a multiple candles forming a bullish engulfing pattern:
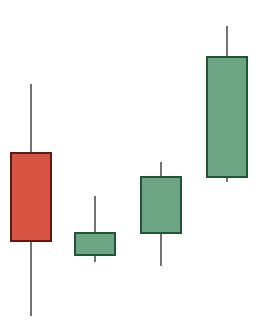
Here you have even more candles. The bullish engulfing candlestick pattern is formed by 4 candles.
NB: Again- what matters is that the red body of the first candle is engulfed by one or more consecutive bullish (green) candles.
PART 2– Bearish Engulfing Candlestick and Price Action
What is a bearish engulfing candlestick pattern
The complete opposite.
What has been said so far for the bullish engulfing pattern is completely right for the bearish engulfing pattern, but in reverse order.
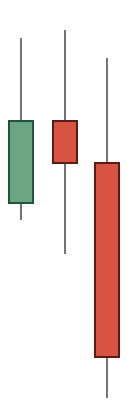
By definition, a bearish engulfing candlestick pattern is small green (or bullish) candle followed by a larger red (bearish) candle eclipsing or “engulfing” the small green candle. Have a look below for a better visualisation:
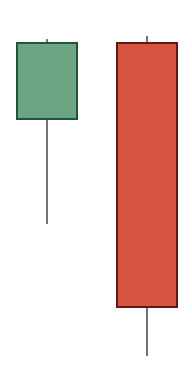
This is a perfect example of a green candle that is fully engulfed by a red (bearish) candle forming a bearish engulfing candlestick pattern. In an ideal world traders should only be using this type of bearish engulfing pattern, but as we have seen above, there are different variations of the engulfing pattern.
Just like the bullish engulfing, behind the bearish engulfing pattern stands pure price action. What matters is that the number of sellers outweighs the number of buyers.
Other examples of bearish engulfing candlestick patterns
Identical (but reversed) to the bullish engulfing, the bearish engulfing candlestick pattern could be formed of more than two candles.
In the example below, three candles are forming a bearish engulfing pattern:
That is a great example of why the bearish engulfing pattern is so powerful. In the exhibit above a small green candle is followed by two red (bearish) candles fully engulfing the body of the green candle.
From a price action standpoint that means that the bulls are too weak and bears take control of the action thus pushing the price down.
Important: Bearish engulfing candlestick patterns are extremely strong continuation patterns in downtrends.
Therefore, trying to use bearish engulfing candlestick patterns as a reversal market indication is not as effective. The power of the bearish engulfing pattern is in following the trend. They are most powerful when the market takes a break, makes a bullish correction and then forms a bearish engulfing pattern. That is probably the best place for a bearish engulfing pattern to form, just like the screenshot below:
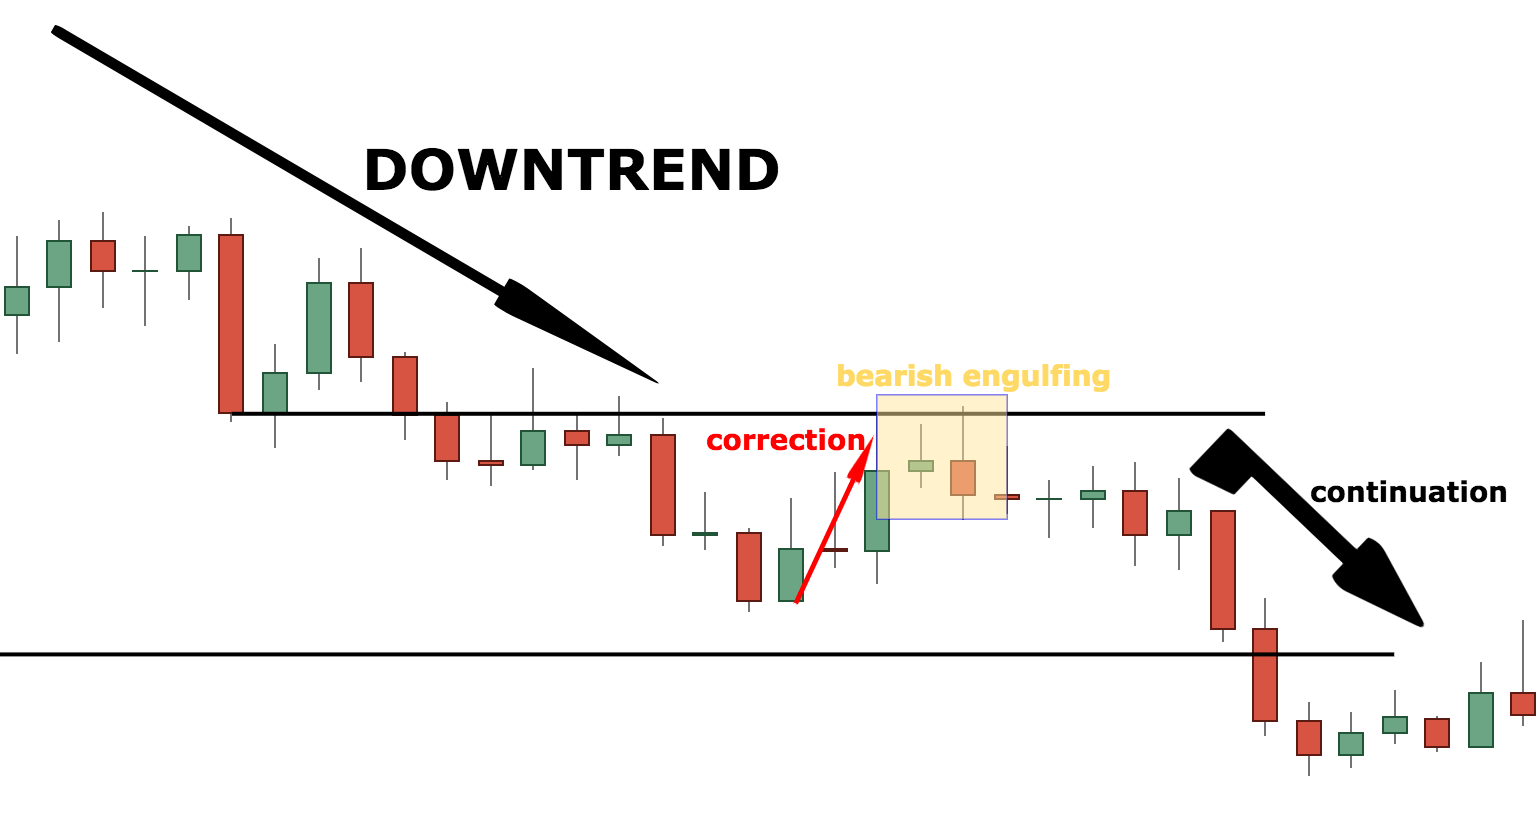
In the example above you can see how in a downtrend the price makes a small correction, then forms a bearish engulfing pattern and shortly after the trend is resumed.
Bullish Engulfing and Bearish Engulfing Patterns Used in Conjunction with Other Technical Analysis Tools
In technical analisys there are different tools that could be used in conjunction with candlestick patterns. Amongst the most famous ones is the concept of support and resistance.
For a full explanation of this concept, you can visit my specially dedicated article on this topic HERE
This article will really give you a comprehensive understanding of the support and resistance concept.
For the sake of this article, we will just give an example of support and a bullish engulfing pattern:
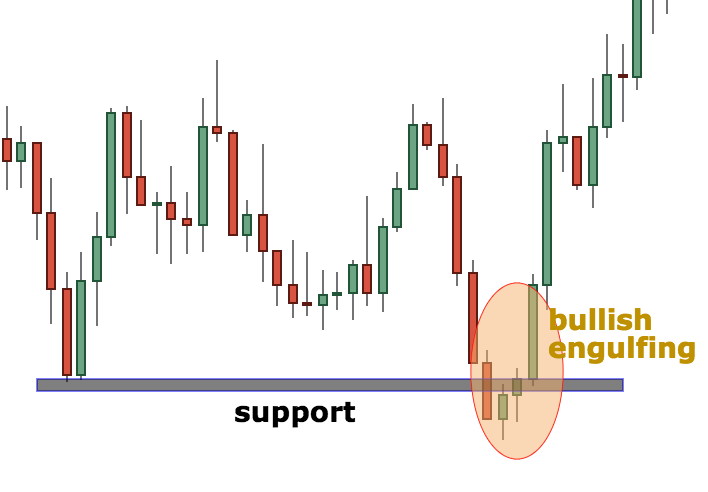
As you can see from the example above, the red candle was followed by three consecutive green (bullish) candles forming on top of a major support area. This gives even further confidence to market participants and pushes the price very quickly higher. As you can see, after the bullish engulfing pattern is formed, the next candle is extremely long and thus marks the extremely bullish bias of the market.
Resistance and the bearish engulfing pattern
In another example, I would like to show you how powerful the bearish engulfing pattern could be in conjunction with a resistance level:
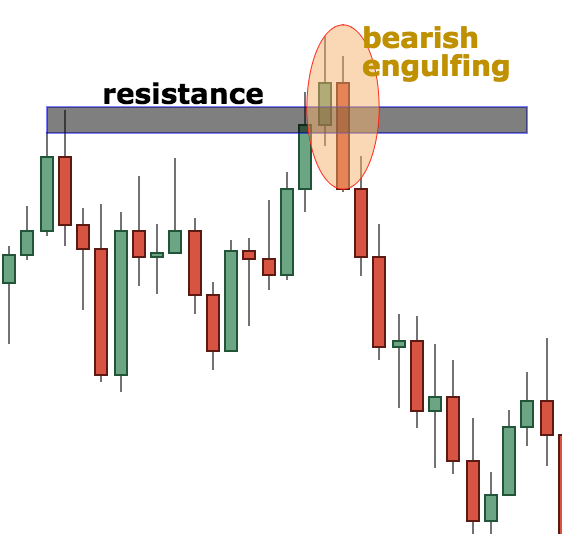
In the example above you can see the opposite scenario. There is a resistance area and a bearish engulfing pattern forms. There are only two candles that comprise the bearish engulfing candlestick pattern. As we have already emphasised, what matters is not the number of candles, but the ability of the bears to “engulf” the bulls, thus showing market participants the readiness of sellers.
As you can see above, after the bearish engulfing pattern was formed, the downtrend is continued by two large red (bearish) candles.
Moving Averages
Moving averages are another great tool for checking for the direction of the major trend. Different traders are using moving averages differently. For this reason I have created an introductory article on moving averages HERE
In conjunction with candles, moving averages could give a very useful indication of a possible entry. Let’s take an example of a bullish engulfing pattern.
Bullish engulfing and 200 EMA
In the chart below you can see a 200 day Exponential Moving Average (EMA) and a bullish engulfing pattern. As you probably rightly expect already, that is a great confluence of factors, which leads to an increased bullish enthusiasm:
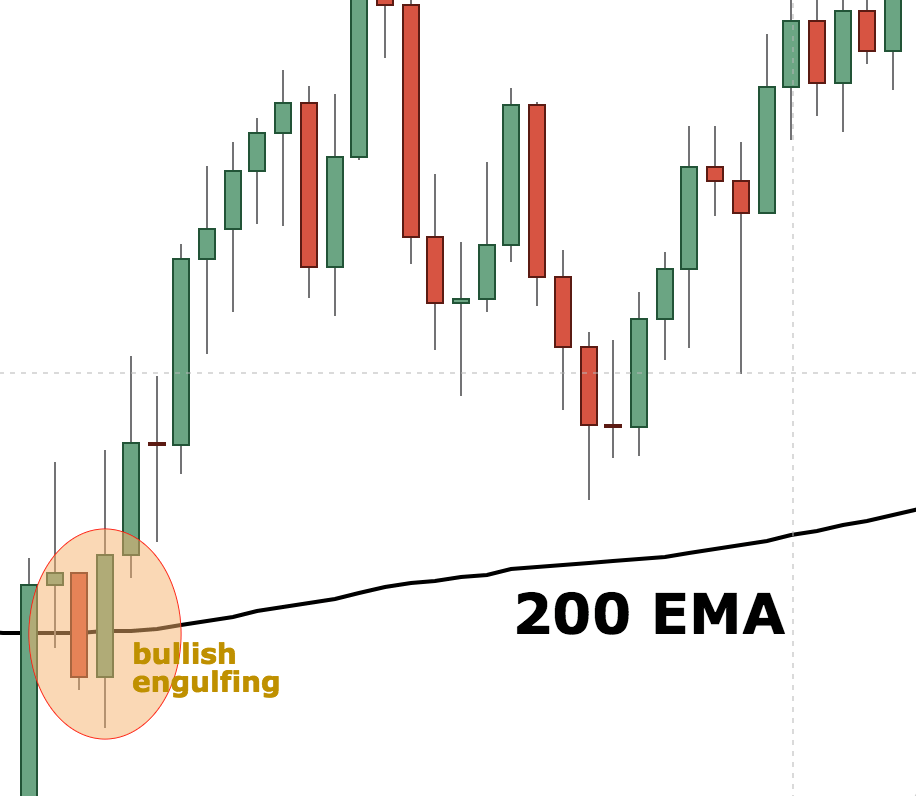
It is very important to note here that different traders are using technical analysis in different ways. If there is one thing on which most would agree is a confluence of a long-term moving average with a candlestick pattern confirmation just like the one above.
Let’s see the reverse scenario now.
Bearish engulfing and 200 EMA
In the chart below you can see the 200-day EMA and a bearish engulfing pattern:
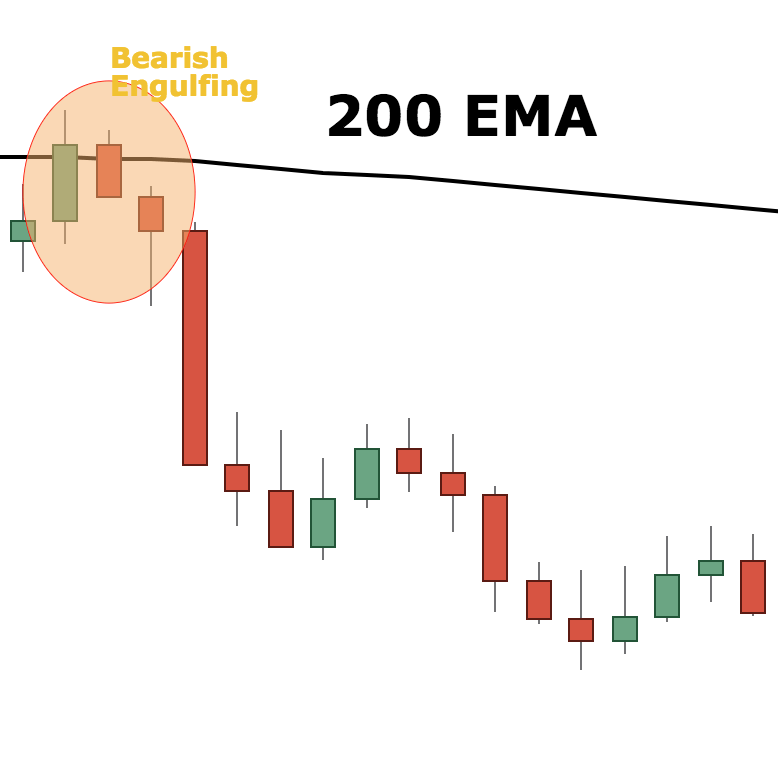
The example above shows a three-bodied bearish engulfing pattern. As agreed above, the number of candles does not matter as long as they engulf the previous candle.
You can see how large the candle following the bearish engulfing is. The reason for that is that the market is indicating a confluence of bearish factors, which lead to a lot of market participants shorting it after the completion of the bearish engulfing pattern.
Other tools and indicators used with candlesticks
There are numerous other tools that are used in conjunction with candlestick patterns and in particular the bullish engulfing and bearish engulfing patterns.
Some of them are:
RSI Indicator
MACD Indicator
Stochastic Indicator
Chart Patterns
CONCLUSION– Bullish Engulfing and Bearish Engulfing in Price Action
Bullish engulfing and bearish engulfing patterns are probably the most widely used candlestick patterns among traders. The reasons are different, but what is more important here is how to do traders use those candlestick patterns.
In this article I have covered how I see price action and candlesticks and in particular the bullish engulfing and bearish engulfing patterns.
To sum it all up, I would say that apart from being an inseparable part of my professional trading strategy, the bullish engulfing and bearish engulfing patterns are extremely important for price action traders. Some of the most important factors for trading with bullish and bearish engulfing patterns are:
-
Bullish engulfing candlesticks represent the willingness of buyers to continue holding a certain financial instrument
-
Bearish engulfing patterns represent the willingness of sellers to continue selling a certain currency pair or financial instrument
-
Bullish and bearish engulfing patterns are extremely powerful when they are used in conjunction with the existing trend
-
Bullish and bearish engulfing patterns are having an extremely strong connotation, especially around major/minor support and resistance areas and moving averages
In the article above has been shown that bullish and bearish engulfing candlestick patterns could be formed in different ways and combinations. What matters is what stands behind those patterns and it is pure price action and market psychology. It is important to understand the principles behind those and to be able to apply them correctly in an ever-changing environment.
Author

Colibri Trader
Colibri Trader
Colibri Trader, as he is known in the circles, is based in London, UK. He Started his career in one of the leading prop trading houses at the time and then has moved out to form his own company- Colibri Trader Limited.


