The screenshot below shows a shift from longs in control to a battle to maintain control to sellers in control.
Weekly VWAP (yellow line) restarts with each new week. You can see four weeks of rising prices, a one-week "battle" with long traders "hanging in there", and finally, two weeks of prices moving down, signalling sellers are in control.
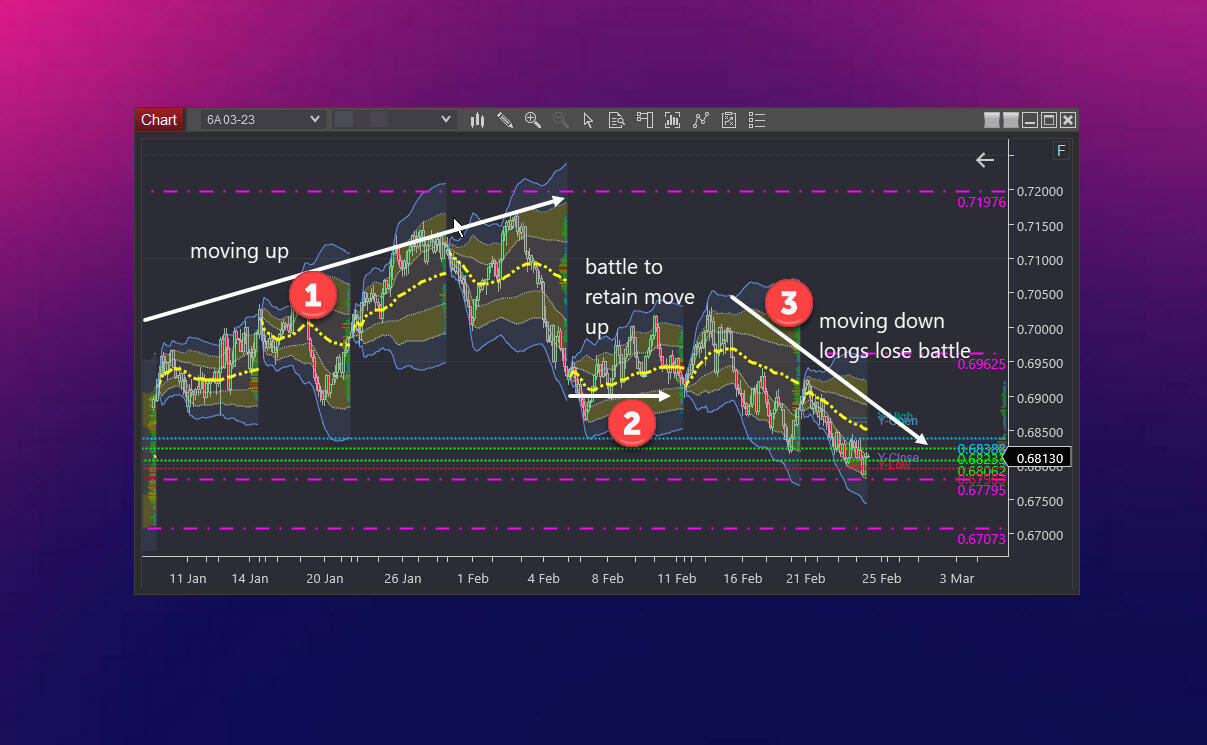
I'm going short. Right? Not so fast.
Considerations: The latest CFTC COT report shows commercials are net long and speculators are net short, albeit in declining quantities.
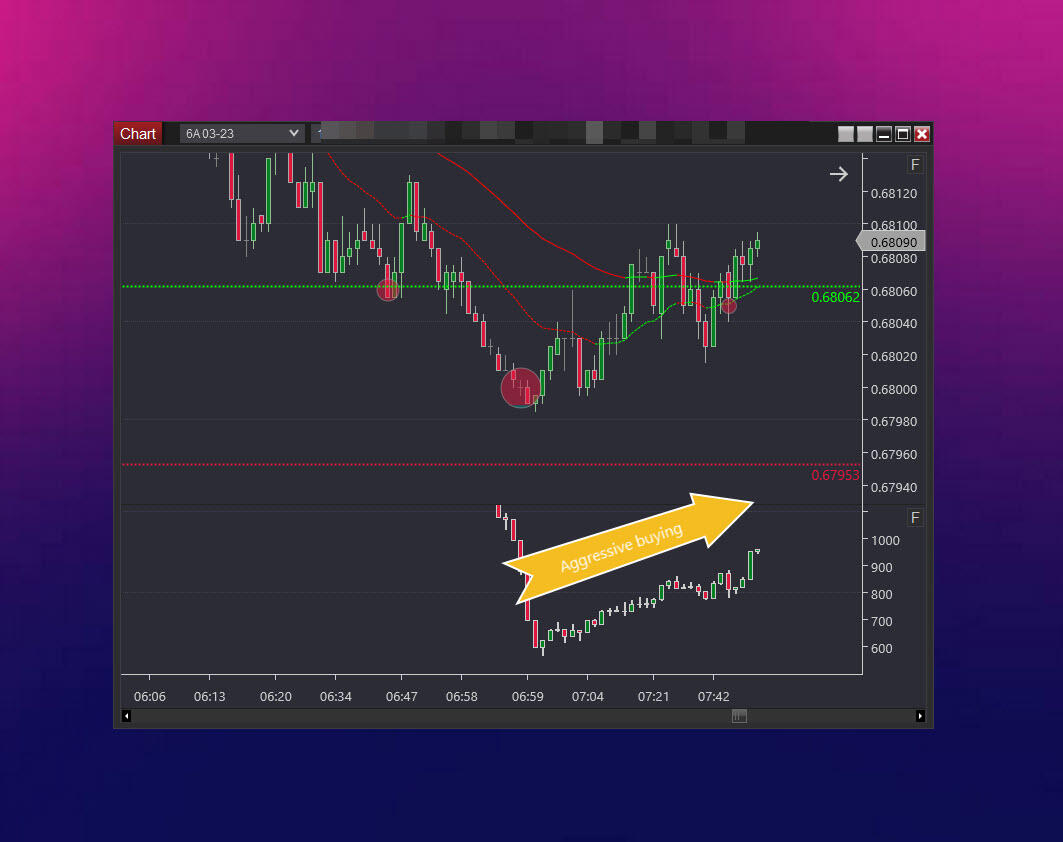
The next chart is a collaboration of observations. See where long traders front-ran a known relative value price at 0.6795. As you'll see in a minute, this level will play a vital role.
Zooming in and notice the aggressive lifting of offers shown by the delta slope.
What do the points covered so far have to do with age? Synthesizing different perspectives and seeing between the differing views to extract and exploit a trading opportunity uses relativistic thinking. A thinking skill only completely accessible post-50 yrs of age.
Spoiler Alert: Here's the move in its entirety. But it wasn't simply a case of buying the low & selling the high. The horizontal lines - green, red and blue show the 'playing field'. These are the same levels that appear on the 2nd chart.
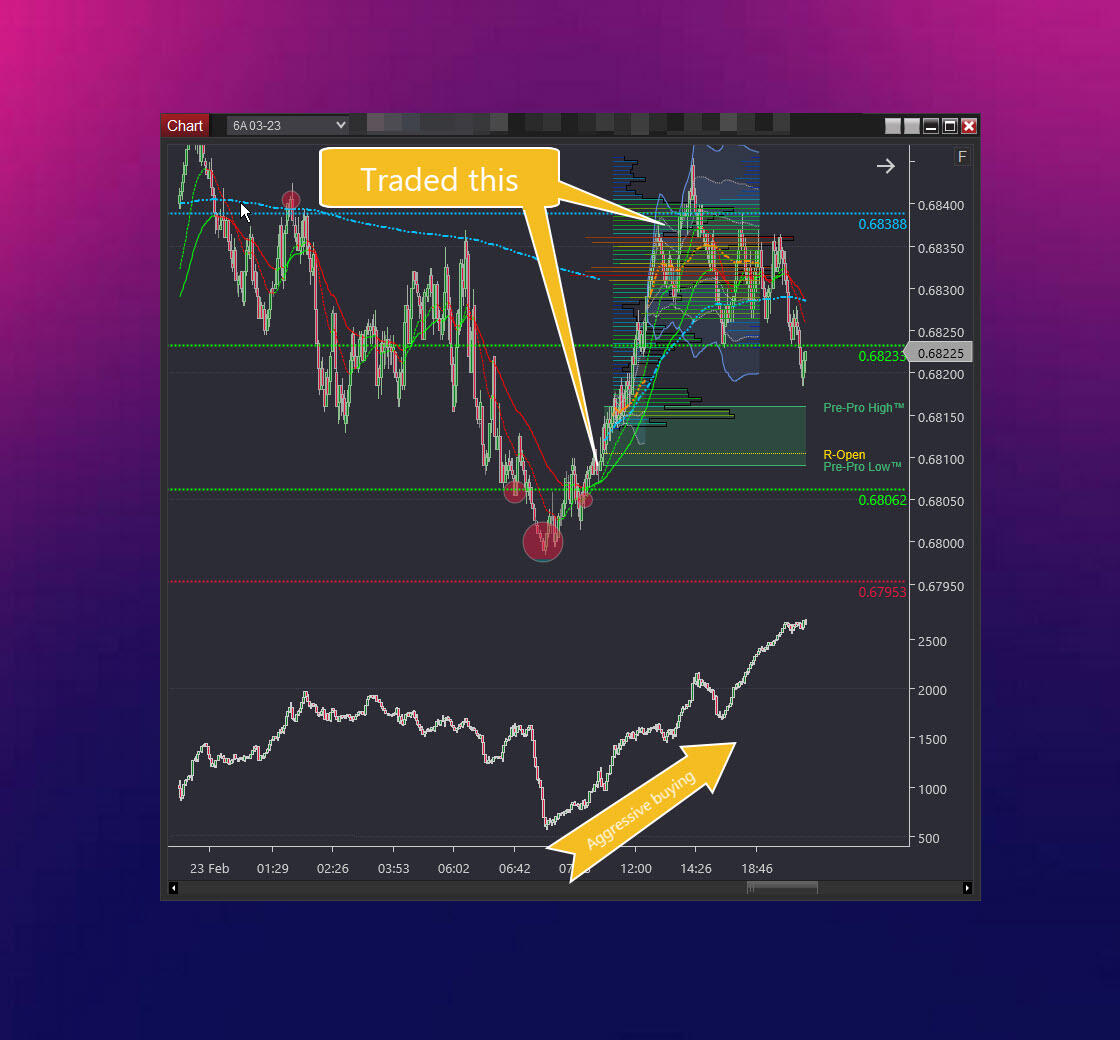
The horizontal price levels mark the boundaries of the playing field and bring order and structure to the unruly characteristic of price movement. They inform you of the price ranges of where it's okay to trade (within the playing field) and where not to trade (out-of-bounds).
Here's where things get really interesting!
You can see the power of the playing field as the market traded post-analysis.
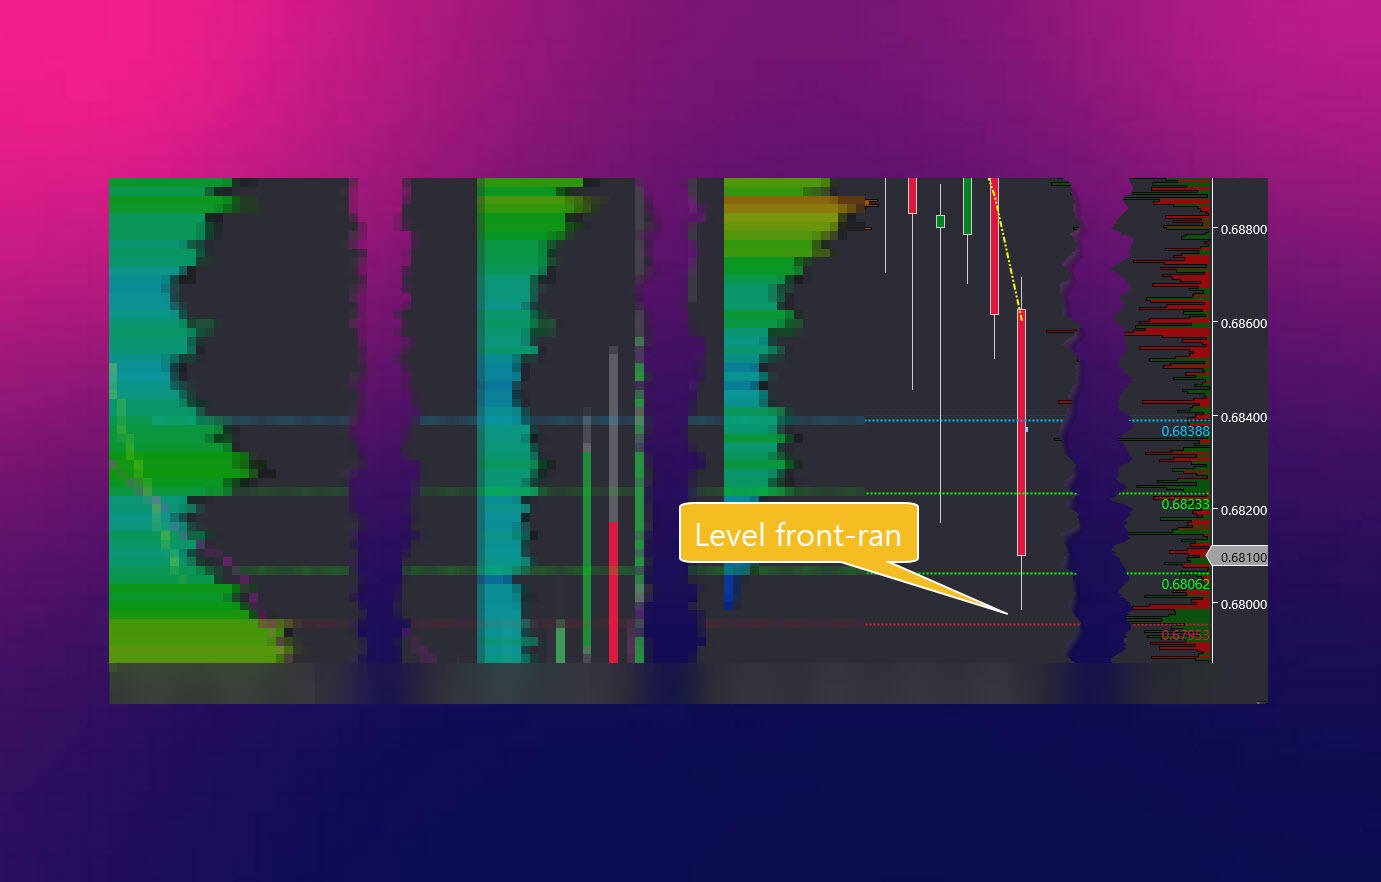
Below shows you what traders commonly refer to as footprint view. It shows buyers lifting offers and sellers hitting bids. Using color shading intensity, the more intense the color green, the higher the number of contracts "lifted" at the corresponding offer price. Similarly, the more intense the color red, the higher the number of contracts "hit" at the corresponding bid price.
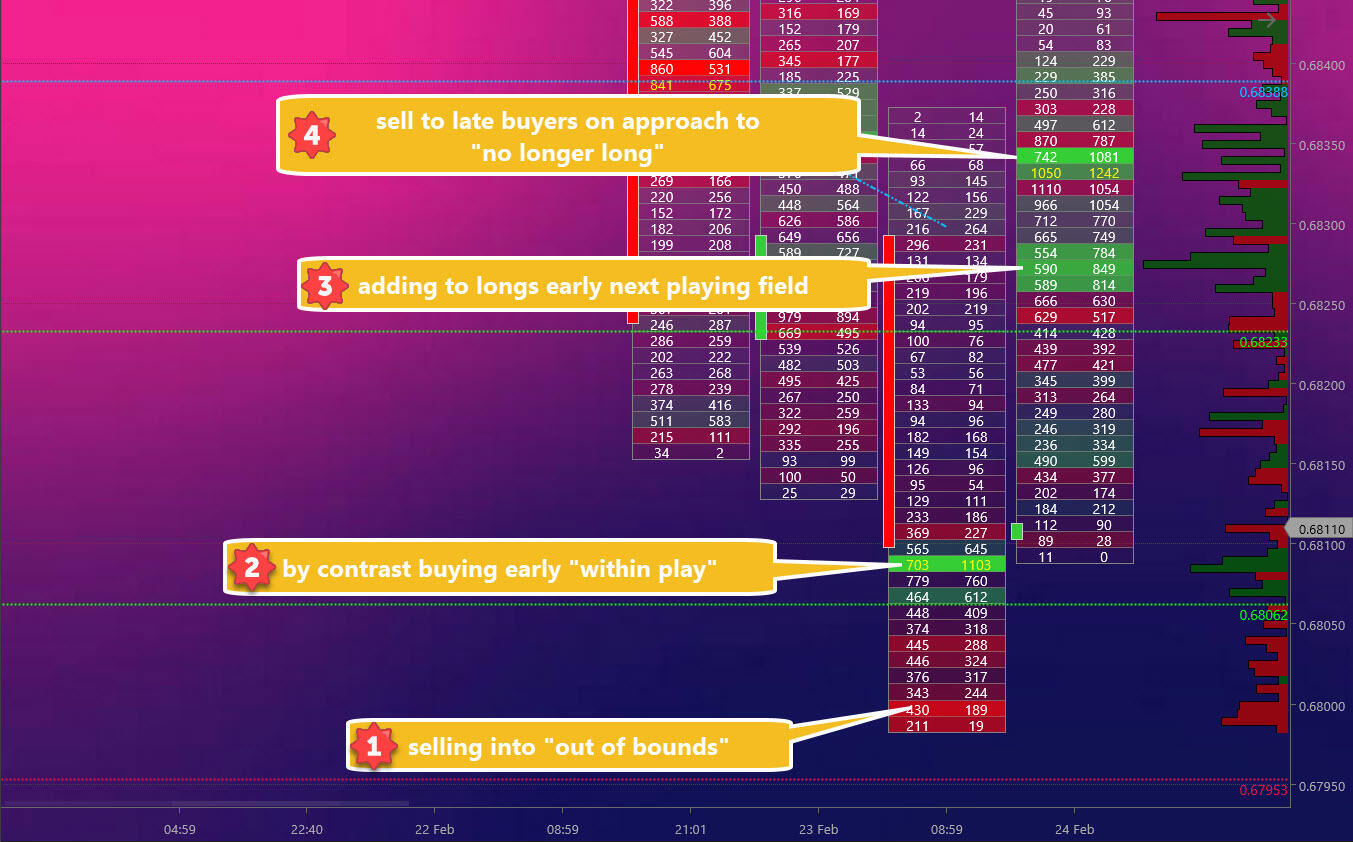
- Recall the front-running? And notice the sellers entering at the edge of out-of-bounds?
- Large buyers step in at the next playing field only once firmly established.
- Repeat of what occurred at point 2
- Approaching out-of-bounds, those who bought at levels 1, 2 and 3 sell into late buyers.
I expand on the 4 points in the upcoming video for further explanation.
The playing field was developed using systematic thinking. A skill only completely accessible post-50 yrs of age. But systematic thinking in trading doesn't end there. It also characterizes flexibility and fluency in generating ideas.
See systematic thinking when live trading during the market movement we've discussed.
Forex and derivatives trading is a highly competitive and often extremely fast-paced environment. It only rewards individuals who attain the required level of skill and expertise to compete. Past performance is not indicative of future results. There is a substantial risk of loss to unskilled and inexperienced players. The high degree of leverage can work against you as well as for you. Before deciding to trade any such leveraged products you should carefully consider your investment objectives, level of experience, and risk appetite. The possibility exists that you could sustain a loss of some or all of your initial investment and therefore you should not invest money that you cannot afford to lose. You should be aware of all the risks associated with trading on margin, and seek advice from an independent
Editors’ Picks

EUR/USD flirts with daily highs, retargets 1.1900
EUR/USD regains upside traction, returning to the 1.1880 zone and refocusing its attention to the key 1.1900 barrier. The pair’s slight gains comes against the backdrop of a humble decline in the US Dollar as investors continue to assess the latest US CPI readings and the potential Fed’s rate path.

GBP/USD remains well bid around 1.3650
GBP/USD maintains its upside momentum in place, hovering around daily highs near 1.3650 and setting aside part of the recent three-day drop. Cable’s improved sentiment comes on the back of the Greenback’s irresolute price action, while recent hawkish comments from the BoE’s Pill also collaborate with the uptick.

USD/JPY edges up above 153.50 with all eyes on US CPI figures
USD/JPY appreciates above 153.00 but remains on track for a 2.4% weekly loss. Trading volumes remain subdued on Friday, ahead of the IS CPI release. The Yen remains supported by hopes of a stable government and calls for further BoJ tightening.
Editors’ Picks

EUR/USD: Yes, the US economy is resilient – No, that won’t save the US Dollar Premium
Some impressive US data should have resulted in a much stronger USD. Well, it didn’t happen. The EUR/USD pair closed a third consecutive week little changed, a handful of pips above the 1.1800 mark.

Gold: Metals remain vulnerable to broad market mood Premium
Gold (XAU/USD) started the week on a bullish note and climbed above $5,000 before declining sharply and erasing its weekly gains on Thursday, only to recover heading into the weekend.

GBP/USD: Pound Sterling remains below 1.3700 ahead of UK inflation test Premium
The Pound Sterling (GBP) failed to resist at higher levels against the US Dollar (USD), but buyers held their ground amid a US data-busy blockbuster week.

Bitcoin: BTC bears aren’t done yet
Bitcoin (BTC) price slips below $67,000 at the time of writing on Friday, remaining under pressure and extending losses of nearly 5% so far this week.

US Dollar: Big in Japan Premium
The US Dollar (USD) resumed its yearly downtrend this week, slipping back to two-week troughs just to bounce back a tad in the second half of the week.
RECOMMENDED LESSONS
Making money in forex is easy if you know how the bankers trade!
I’m often mystified in my educational forex articles why so many traders struggle to make consistent money out of forex trading. The answer has more to do with what they don’t know than what they do know. After working in investment banks for 20 years many of which were as a Chief trader its second knowledge how to extract cash out of the market.
5 Forex News Events You Need To Know
In the fast moving world of currency markets where huge moves can seemingly come from nowhere, it is extremely important for new traders to learn about the various economic indicators and forex news events and releases that shape the markets. Indeed, quickly getting a handle on which data to look out for, what it means, and how to trade it can see new traders quickly become far more profitable and sets up the road to long term success.
Top 10 Chart Patterns Every Trader Should Know
Chart patterns are one of the most effective trading tools for a trader. They are pure price-action, and form on the basis of underlying buying and selling pressure. Chart patterns have a proven track-record, and traders use them to identify continuation or reversal signals, to open positions and identify price targets.
7 Ways to Avoid Forex Scams
The forex industry is recently seeing more and more scams. Here are 7 ways to avoid losing your money in such scams: Forex scams are becoming frequent. Michael Greenberg reports on luxurious expenses, including a submarine bought from the money taken from forex traders. Here’s another report of a forex fraud. So, how can we avoid falling in such forex scams?
What Are the 10 Fatal Mistakes Traders Make
Trading is exciting. Trading is hard. Trading is extremely hard. Some say that it takes more than 10,000 hours to master. Others believe that trading is the way to quick riches. They might be both wrong. What is important to know that no matter how experienced you are, mistakes will be part of the trading process.
The challenge: Timing the market and trader psychology
Successful trading often comes down to timing – entering and exiting trades at the right moments. Yet timing the market is notoriously difficult, largely because human psychology can derail even the best plans. Two powerful emotions in particular – fear and greed – tend to drive trading decisions off course.