Zilliqa Price Forecast: ZIL could rally 15% if it closes above $0.11
- Zilliqa price has seen significant returns since it closed above the 12-hour 100 SMA on February 1.
- This rally could continue if ZIL closes above a crucial level at $0.11.
- A correction may come into the picture if support at $0.09 is invalidated.

Zilliqa price witnessed a 325% upswing between December 1 and 27, 2020. However, the Doji candlestick on the 12-hour chart signalled the end of this rally. The resulting pullback pushed ZIL into a consolidation pattern until its breakout on February 1.
Zilliqa price pushes for a higher high
Zilliqa price has risen nearly 60% since its close above the ascending triangle pattern on February 1. Interestingly, the bounce from the 12-hour 100 SMA helped ZIL find a foothold required for this breakout.
Now, Zilliqa faces selling pressure around the $0.11 price level. Therefore, a 12-hour candlestick close above this barrier confirms the bullish momentum. This could allow the token to rally another 15% to hit $0.12.
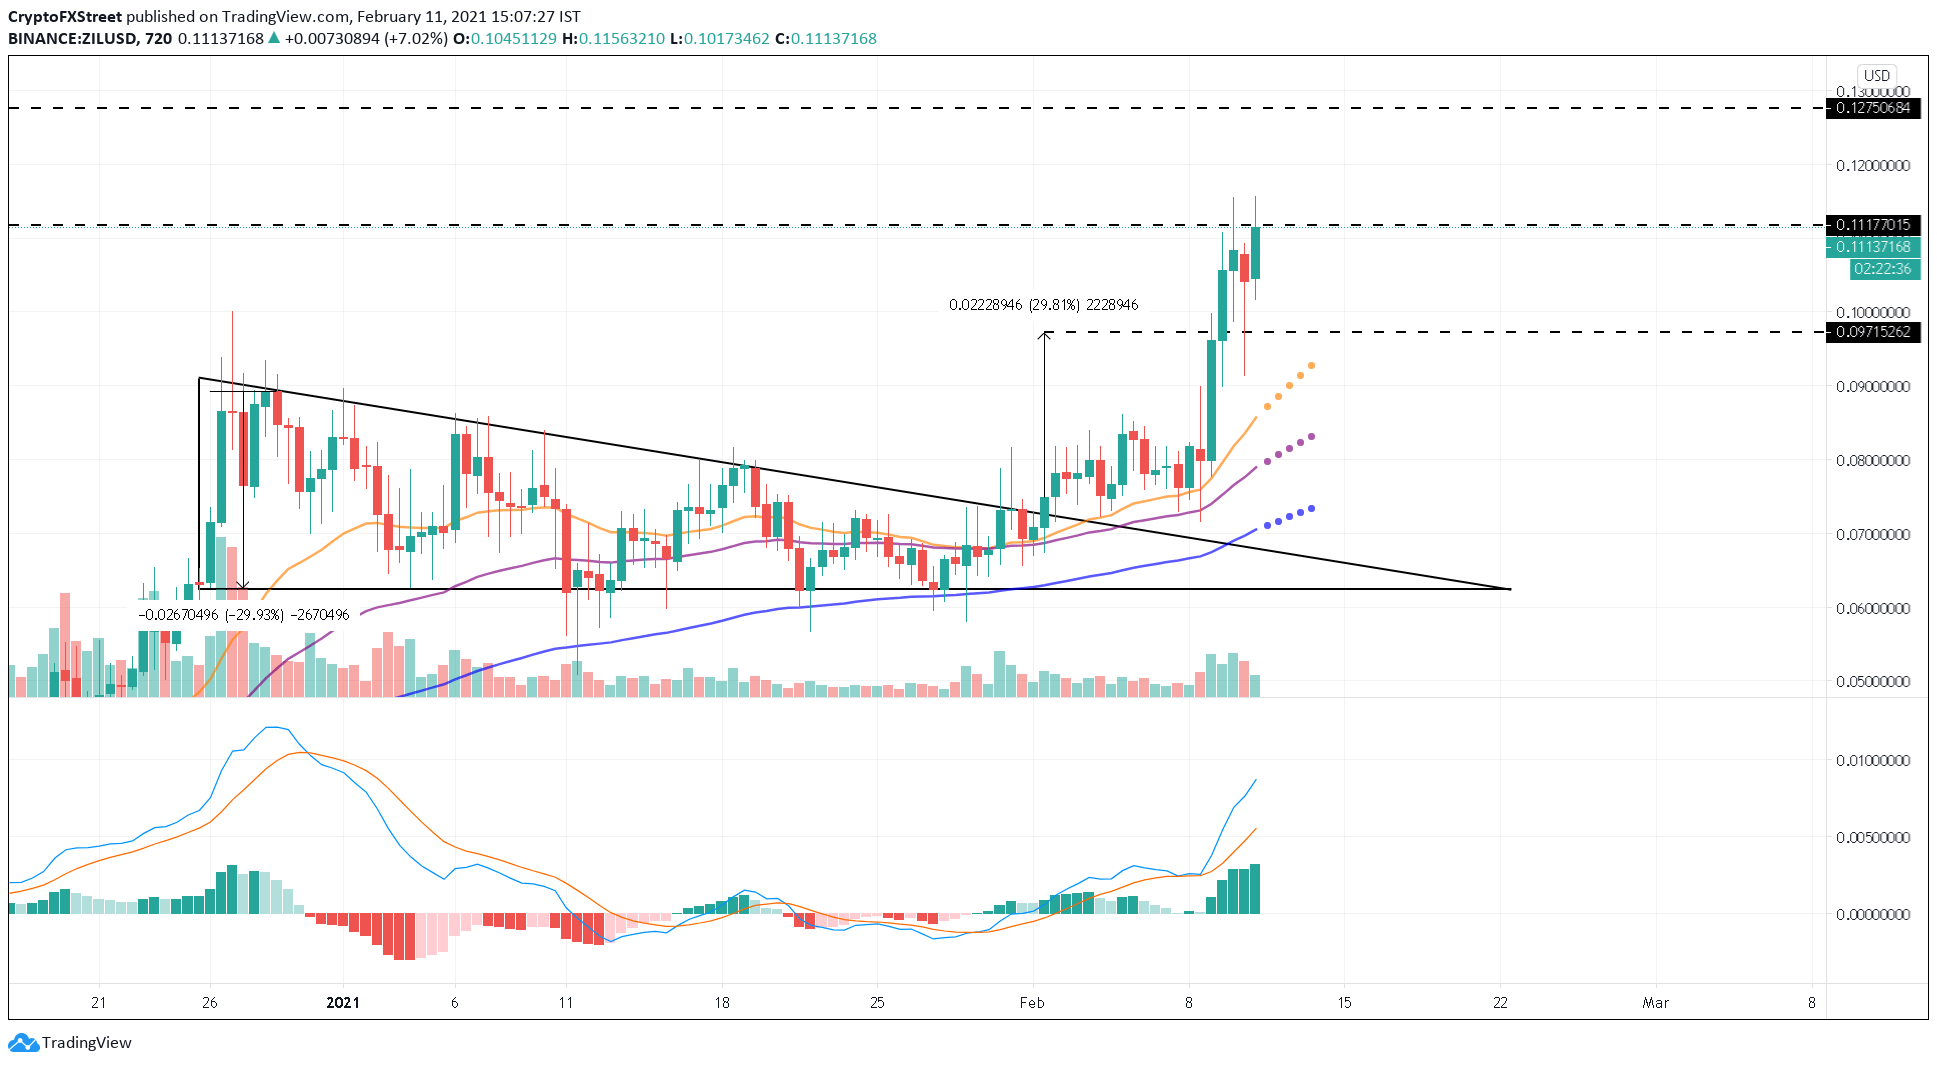
ZIL/USDT 12-hour chart
The Moving Average Convergence Divergence (MACD) indicator reinforces ZIL’s bullish outlook. In addition to being in the positive range (above the zero-line), the MACD line (12 SMA) has stayed above the signal line (26 SMA), preserving the bullish crossover.
ZIL price saw a 17% jump between February 10 and 11, when the developer index increased by 17% from 0.17 to 0.20. Usually, investors perceive this as a bullish sign since project rollouts or updates often follow high developer activity.
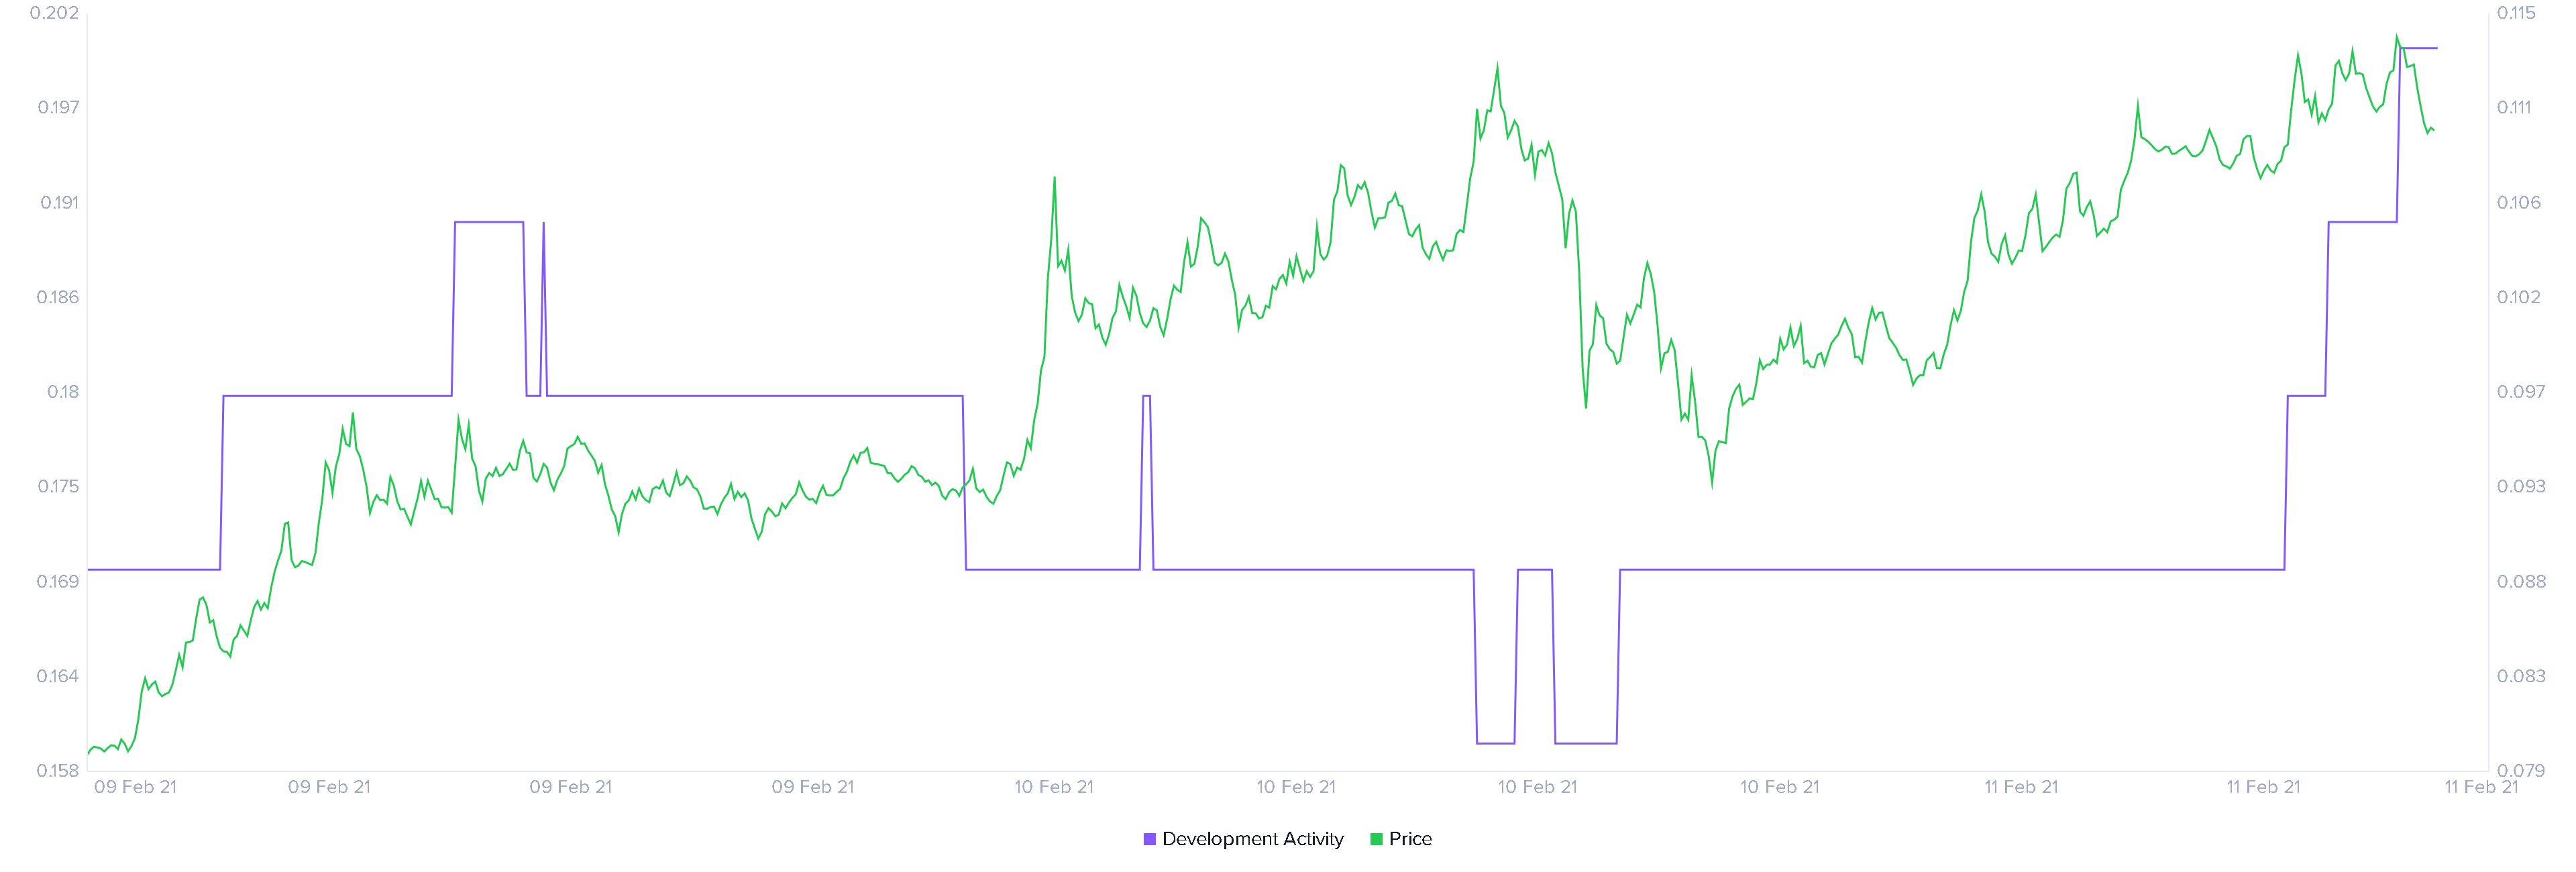
Zilliqa Developer Activity chart
While everything seems to be looking up for ZIL, investors should note that rejection at the $0.11 level could push ZIL down to the support at $0.09. A breakdown of this support due to increased selling pressure will invalidate ZIL’s positive outlook. Hence, a resulting correction could send ZIL down to the 12-hour 100 SMA around the $0.075 level.
Author

Akash Girimath
FXStreet
Akash Girimath is a Mechanical Engineer interested in the chaos of the financial markets. Trying to make sense of this convoluted yet fascinating space, he switched his engineering job to become a crypto reporter and analyst.


