Zilliqa Price Forecast: ZIL teeters on the edge of a 30% decline
- Zilliqa price reverses the breakout from a symmetrical triangle pattern after reaching 61.8% Fibonacci retracement.
- ZIL retesting the strategically important rising trend line from the March 2020 low.
- A close below the May 30 low of $0.092 confirms a drop to the May 23 low of $0.069, representing a 30% decline.

Zilliqa price currently rests below the 200-day simple moving average (SMA) and on the rising trend line from the March 2020 low. The short-term outlook has naturally switched from mildly bullish to bearish, with May’s lows as potential targets if the trend line fails to block mounting selling pressure.
Zilliqa price falls under the weight of an apprehensive crypto market
To review, Zilliqa price declined over 70% from the all-time high of $0.262 to the May 23 low of $0.069. The remarkable decline followed multiple attempts to overcome the 2018 high of $0.235, resulting in a double top that loudly triggered on May 19 with a drop below $0.115.
Zilliqa price tried to identify support around the 40-week SMA, the March 2020 rising trend line and the 23.60% retracement of the March 2020-May 2021 advance before falling to $0.069. ZIL followed the May 23 washout with a 100% rally into the May 27 high but turned lower again until rallying from May 30 to June 3. In the process, the digital asset released from a symmetrical triangle, supported by a burst in volume.
The breakout from the symmetrical triangle has since reversed, pushing Zilliqa price below the 200-day SMA to the May 2020 rising trendline at $0.101. ZIL is defending the trend line, but a daily close below the trend line, and more importantly, below the May 30 low of $0.092, would heighten the risk of a new correction low moving forward.
The measure move target of the symmetrical triangle is $0.054, representing a decline of just over 54% from the triangle’s lower trend line on the day of the breakdown.

ZIL/USD daily chart
A daily close above the double top trigger of $0.115 would turn the outlook from bearish to neutral.
The weekly ZIL chart flags the importance of the support framed by the March 2020 rising trend line at $0.101, with the 40-week SMA at $0.091. Moreover, the chart reveals an air pocket below the May 23 low until the 38.2% retracement of the 2020-2021 advance.
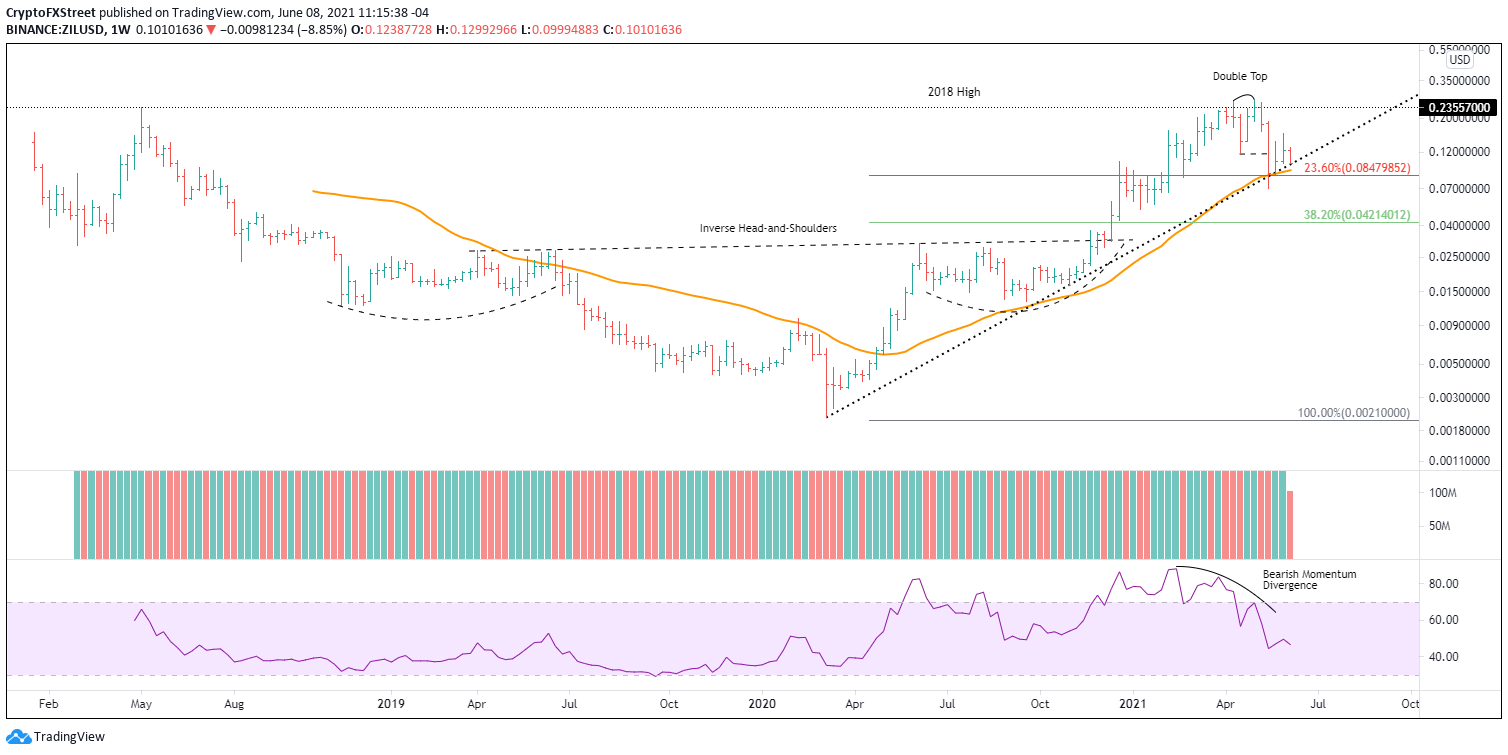
ZIL/USD weekly chart
With scalability challenges engulfing the blockchain community, the ZIL blockchain project is becoming a vital solution for accelerating the number of transactions that can be processed per second. The fundamental momentum has the potential to underpin the Zilliqa price quest for new all-time highs. Still, the current technical state of the cryptocurrency is volatile, offering little leverage to begin a new rally higher.
Author

Sheldon McIntyre, CMT
Independent Analyst
Sheldon has 24 years of investment experience holding various positions in companies based in the United States and Chile. His core competencies include BRIC and G-10 equity markets, swing and position trading and technical analysis.


