Zilliqa Price Prediction: ZIL rally commences, targets 80% gain
- Zilliqa price disposes of May’s declining trendline and triggers double bottom with a 70% rally over five days.
- 61.8% Fibonacci retracement of May’s correction now providing resistance.
- ZIL rally building off the most oversold reading on the daily Relative Strength Index (RSI) since March 2020.

Zilliqa price has accomplished a notable rally since the May 30 low after capturing support at the March 2020 trend line. The magnitude of the advance in such a short period combined with the 61.8% retracement level resistance could temporarily halt the advance. However, the larger ZIL outlook is still focused on overcoming the 2018 high and 2021 all-time high.
Zilliqa price asserts relative strength after a period of uncertainty
To review, Zilliqa price declined over 70% from the all-time high at $0.262 to the May 23 low at $0.069. The remarkable decline followed multiple attempts to overcome the 2018 high at $0.235, resulting in a double top pattern that loudly triggered on May 19 with a drop below $0.115.
ZIL tried to identify support around the 40-week simple moving average (SMA), the March 2020 rising trend line and the 23.6% retracement of the advance beginning in March 2020 before falling to $0.069. Zilliqa price followed the May 23 low with a 100% rally into the May 27 high but turned lower again until the rally beginning on May 30.
The successful Zilliqa price breakout above May’s declining trend line has triggered the double bottom at $0.151 and touched the 61.8% retracement of May’s correction at $0.155, asserting ZIL among the leading cryptocurrencies over the last five days.
At present, the next visible ZIL resistance level is the declining 50-day SMA at $0.170, followed by the 78.6% retracement of May’s correction at $0.194.
After passing the 78.6% retracement, ZIL will strike resistance at the 2018 high of $0.235, like in April and early May. A weekly close above the all-time high of $0.262, representing an 80% rally from the price at the time of writing, would confirm that the transcending obstacle has been solved and Zilliqa price can begin a sustainable advance into new highs.
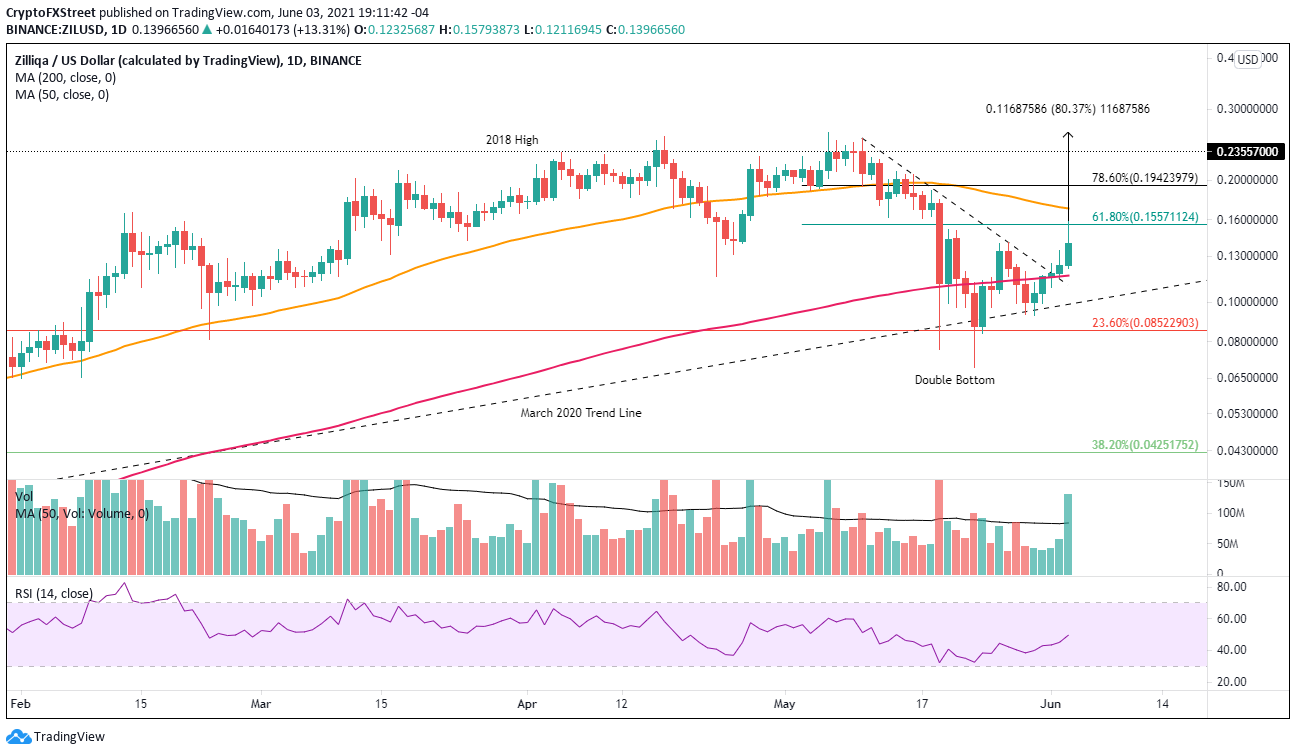
ZIL/USD daily chart
Only an acceleration of ZIL selling below the 200-day SMA at $0.116 would prime a rethink of the overall bullish narrative. Support levels include the March 2020 rising trend line at $.098, the 23.6% retracement of the advance beginning in March 2020 at $0.085, and if things go awry in the broader cryptocurrency market, Zilliqa price could test the May 23 low at $0.069.
With scalability challenges engulfing the blockchain community, the ZIL blockchain project is becoming an essential solution for accelerating the number of transactions that can be processed per second. The fundamental momentum has the potential to sustain the Zilliqa price quest for new all-time highs.
Author

Sheldon McIntyre, CMT
Independent Analyst
Sheldon has 24 years of investment experience holding various positions in companies based in the United States and Chile. His core competencies include BRIC and G-10 equity markets, swing and position trading and technical analysis.



