|

Zcash price is on the brink of a colossal 37% move if any of these two levels break

  • Zcash has been under consolidation for the past two weeks and it’s ready for a move.
  • The digital asset is trading inside a symmetrical triangle pattern on the 4-hour chart.
  • There are two key levels that investors are looking at, which can send Zcash price up or down 37%.

Zcash had a significant run to $120 on January 13 and has been under consolidation since then. The digital asset has established a tightening pattern on the 4-hour chart which seems to be on the verge of breaking.

Zcash price aims for a massive move if these levels break

On the 4-hour chart, the symmetrical triangle pattern is the most notable pattern in the short-term. The support trendline is formed at $84, which means that a breakdown below this point would send Zcash price towards $54, a 37% move. 

zec price

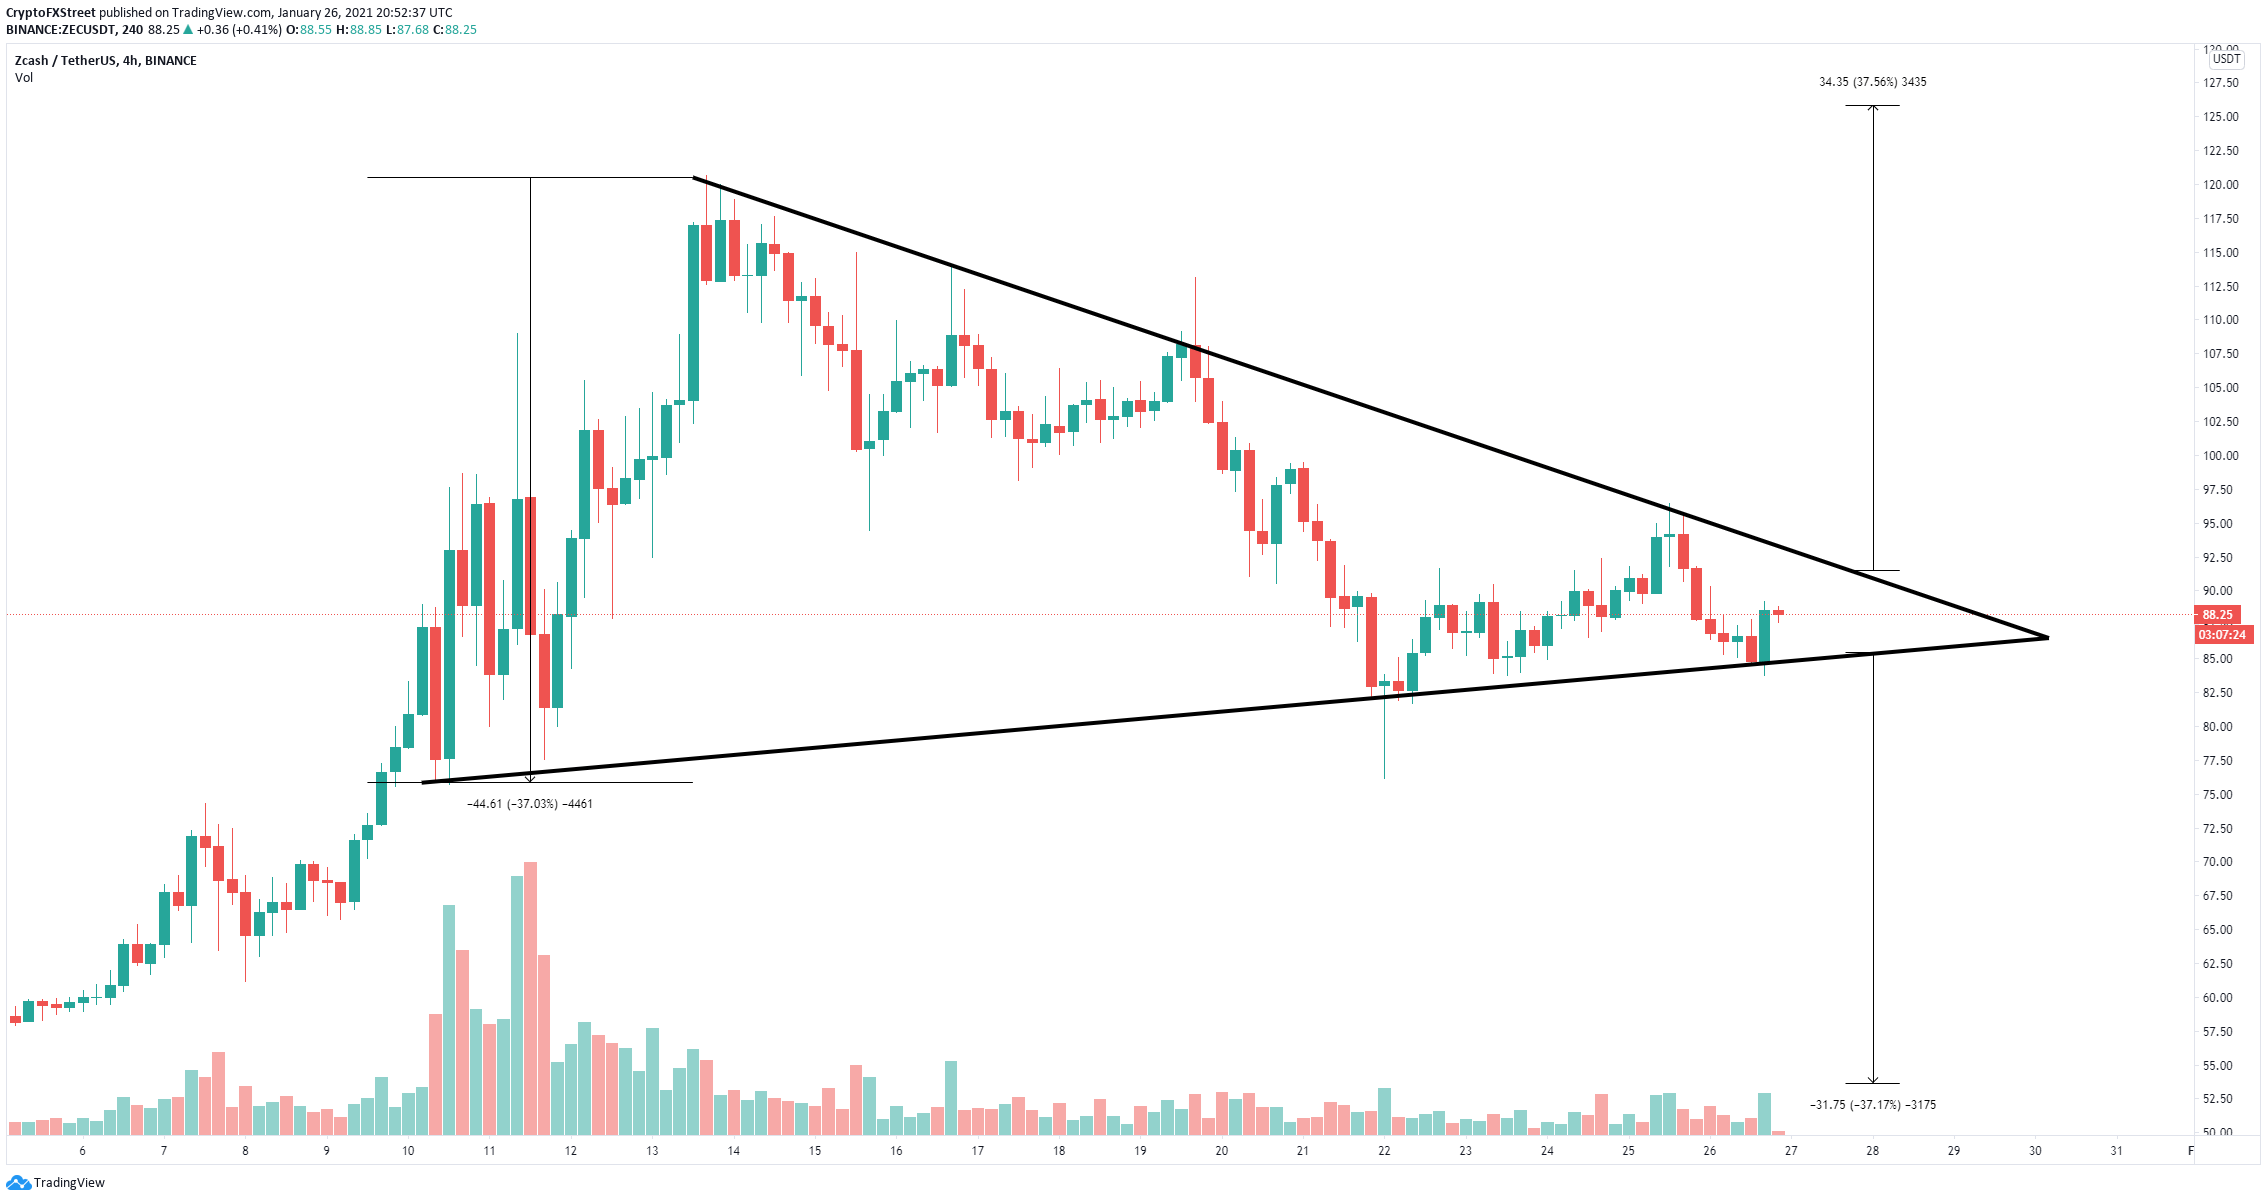
ZEC/USD 4-hour chart

However, if we look at the Global In/Out of the Money (GIOM) chart, there seems to be a lot of support below $90 compared to the resistance above. The resistance trendline is located at $92, and the GIOM model shows a weaker barrier between $95 and $111, with only 184,000 ZEC held by 15,350 addresses.
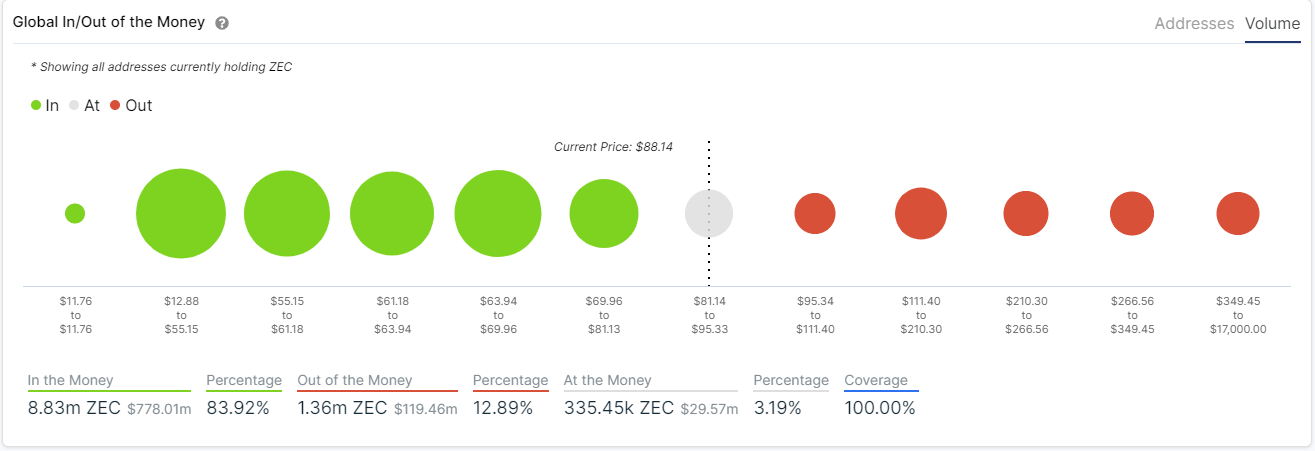
zec price

ZEC GIOM chart

Between $70 and $81, the support area has 1.04 million ZEC held by 50,320, which is significantly higher. A breakout above $92 would quickly push Zcash price towards $126, a 37% move.

Author

Lorenzo Stroe

Lorenzo Stroe

Independent Analyst

Lorenzo is an experienced Technical Analyst and Content Writer who has been working in the cryptocurrency industry since 2012. He also has a passion for trading.

More from Lorenzo Stroe
Share:

Markets move fast. We move first.

Orange Juice Newsletter brings you expert driven insights - not headlines. Every day on your inbox.

By subscribing you agree to our Terms and conditions.

Editor's Picks

Crypto Today: Bitcoin, Ethereum, XRP slide further as risk-off sentiment deepens

Bitcoin faces extended pressure as institutional investors reduce their risk exposure. Ethereum’s upside capped at $3,000, weighed down by ETF outflows and bearish signals. XRP slides toward November’s support at $1.82 despite mild ETF inflows.

Ripple eyes record high breakout in 2026 as Ripple scales infrastructure

XRP has traded under pressure, but short-term support keeps hopes of a sustainable recovery in 2026 alive. The launch of XRP ETFs and regulatory clarity in the US pave the way for institutional adoption.

Bitcoin risks deeper correction as ETF outflows mount, derivative traders stay on the sidelines

Bitcoin (BTC) remains under pressure, trading below $87,000 on Wednesday, nearing a key support level. A decisive daily close below this zone could open the door to a deeper correction.

Monero builds momentum amid bullish bets and looming resistance

Monero (XMR) trades close to $430 at press time on Wednesday, after a 5% jump on the previous day. The privacy coin regains retail interest, evidenced by heightened Open Interest and long positions.

Orange Juice Newsletter – Smart insights by real people. Every day.

A free newsletter highlighting key market trends to help traders stay a step ahead. Daily insights on the most relevant trading topics, compiled by our experts in an easy-to-read format so you never miss an important move.

Bitcoin: Fed delivers, yet fails to impress BTC traders

Bitcoin (BTC) continues de trade within the recent consolidation phase, hovering around $92,000 at the time of writing on Friday, as investors digest the Federal Reserve’s (Fed) cautious December rate cut and its implications for risk assets.