Yearn.Finance Price Prediction: YFI prepares for a 27% upswing as technicals flip bullish
- Yearn.Finance holds above the 100 SMA ahead of an anticipated breakout to $35,000.
- The IOMAP model suggests that the least resistance path is upwards while YFI is sitting on an immense support area.

Yearn.Finance is on the cusp of losing the most expensive cryptocurrency title after Bitcoin embarked on the adventurous journey to hit new all-time high after new all-time high. The decentralized finance (DeFi) token trades around $26,700 while Bitcoin appears to hold at $23,100.
Yearn. Finance on the brink of lifting off to $35,000
The 4-hour chart shows the formation of a symmetrical triangle pattern. The chart pattern is created by converging a couple of trendlines that link sequential peaks and troughs. Generally, the trendlines are supposed to cross at an approximately equal slope. The formation brings to light a period of consolidation ahead of either a breakout or a breakdown.
Realize that a breakdown occurs from the ascending trendline and identifies the beginning of a downtrend. On the other hand, a breakout happens at the descending trendline and signifies the start of a bullish trend. Symmetrical patterns tend to have precise price targets for the breakout or breakdown, mainly measured from the highest point to the pattern's lowest point.
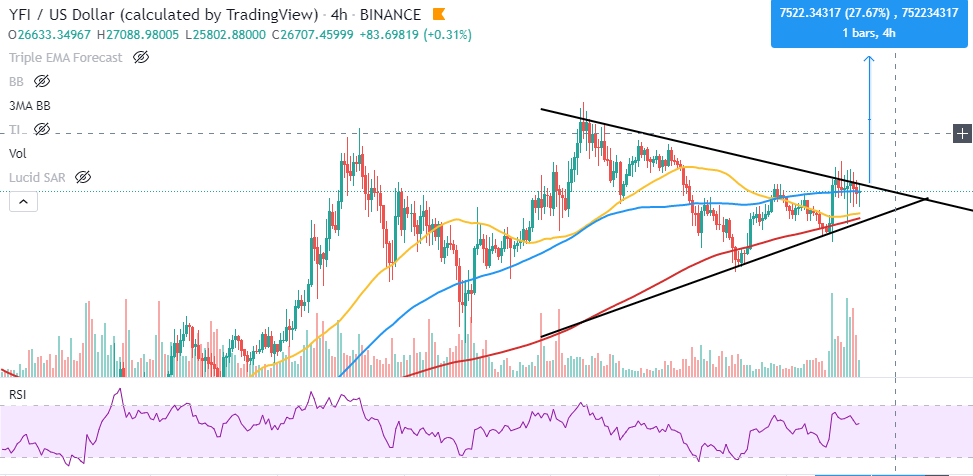
YFI/USD 4-hour chart
If Yearn. Finance closes the day above the 100 Simple Moving Average; a breakout is likely to come into the picture, targeting $35,000 after a 27% spike.
IntoTheBlock's IOMAP model reveals that the path ahead of YFI is relatively smooth apart from the subtle resistance from $26,915 to $27,680. Here, 434 addresses had previously bought about 2,400 YFI. Trading above this zone is likely to boost Yearn.Finance to price levels above $30,000.
On the downside, YFI is sitting on an area with immense support, running from $24,575 to $25,340. Here, 362 addresses had previously purchased approximately 6,000 YFI.
-637438570143055289.png)
Yearn.Finance IOMAP chart
It is worth mentioning that the bullish outlook to $35,000 will be invalidated if YFI slipped and closed the day under the 100 SMA. Moreover, a break under the triangle's ascending trendline might kick start massive declines, perhaps stretching to $18,000.
Author

John Isige
FXStreet
John Isige is a seasoned cryptocurrency journalist and markets analyst committed to delivering high-quality, actionable insights tailored to traders, investors, and crypto enthusiasts. He enjoys deep dives into emerging Web3 tren


