Yearn.Finance Price Forecast: YFI correction to $22,000 catches momentum
- Yearn.Finance slide below the 50 SMA and the 100 SMA confirming the likely breakdown to $22,000.
- The IOMAP could invalidate the bearish outlook in favor of consolidation in the coming sessions.

Yearn.Finance is on the verge of a massive retreat following a recently presented sell signal. The decentralized finance (DeFi) token, has also not been able to come out of a descending parallel channel.
At the time of writing, YFI/USD is seeking support at the channel's middle boundary. If push comes to shove, declines could extend to $22,000
Yearn. Finance downward momentum reinforced
YFI/USD is dancing at $25,500 following a rejection at the channel's upper boundary. Besides, closing the day below the 50 Simple Moving Average and the 100 SMA on the 4-hour appears to have called for more sell orders.
The Relative Strength Index has doubled down on the bearish outlook by retreating to the midline. Support is expected at the 200 SMA and the middle boundary. However, declines will continue if Yearn.Finance stretches further down. The recent anchor at $22,000 is likely to come in handy.
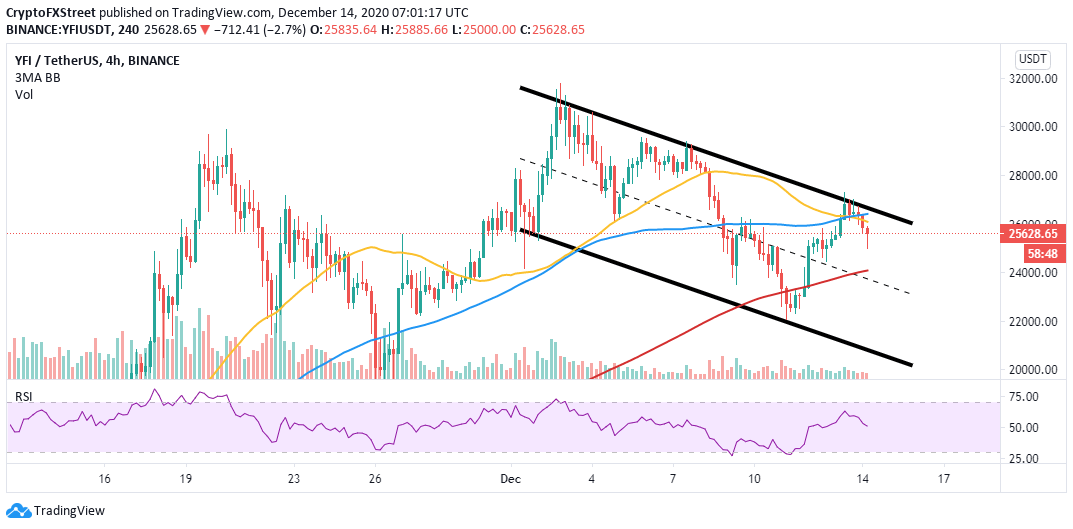
YFI/USD 4-hour chart
The TD Sequential indicator recently presented a sell signal in the form of a green nine candlestick on the 4-hour chart. The bears' tight grip shows that the bearish outlook might dominate the trading in the coming sessions.
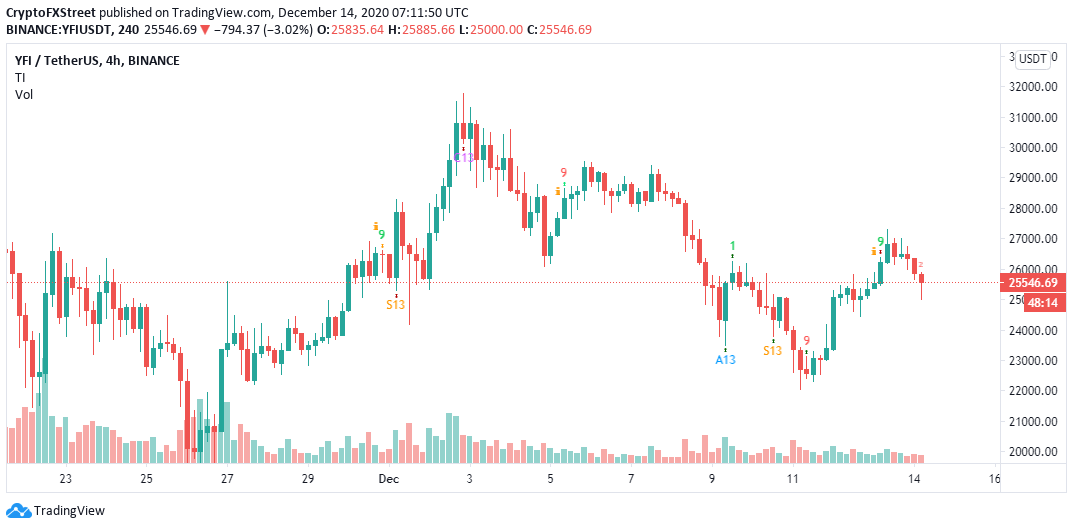
YFI/USD 4-hour chart
he IOMAP model by IntoTheBlock hints at the possibility of consolidation taking over due to the stern resistance and support levels. On the upside, Yearn.Finance is dealing with seller congestion between $25,553 and $26,319. Here, nearly 1,100 addresses previously purchased, roughly 4,200 YFI.
-637435281424174320.png)
Yearn.Finance IOMAP chart
On the flip side, YFI is sitting on an immense support area highlighted from $24,745 to $25,510. Here, 606 addresses previously bought nearly 3,600 YFI.
Author

John Isige
FXStreet
John Isige is a seasoned cryptocurrency journalist and markets analyst committed to delivering high-quality, actionable insights tailored to traders, investors, and crypto enthusiasts. He enjoys deep dives into emerging Web3 tren



