Yearn.Finance Price Prediction: YFI dives into oversold territory which historically marks a bottom
- Yearn.Finance price could be on the verge of a spike as technicals suggest it’s time to buy.
- In the short-term, the digital asset could still see a pullback before resuming the short-term uptrend.

YFI is currently trading at $21,780 after a significant rebound from the low of $18,000 on December 23. Several on-chain metrics have turned in favor of the digital asset, and investors are carefully paying attention.
Yearn.Finance price could slip one more time before a massive spike
On the 3-day chart, the SAR just flipped bearish for the first time since September 21, which accurately predicted the fall of YFI, losing 73% of its value. The next long-term price target would be the 78.6% Fib level at $12,000.
-637444186968877797.png)
YFI/USD 3-day chart
Looking at the MVRV 30D chart, we can locate two significant areas: YFI will likely crash and one where it will likely rebound. Yearn.Finance is on the verge of touching the undervalued zone, which usually translates into a massive rebound spike.
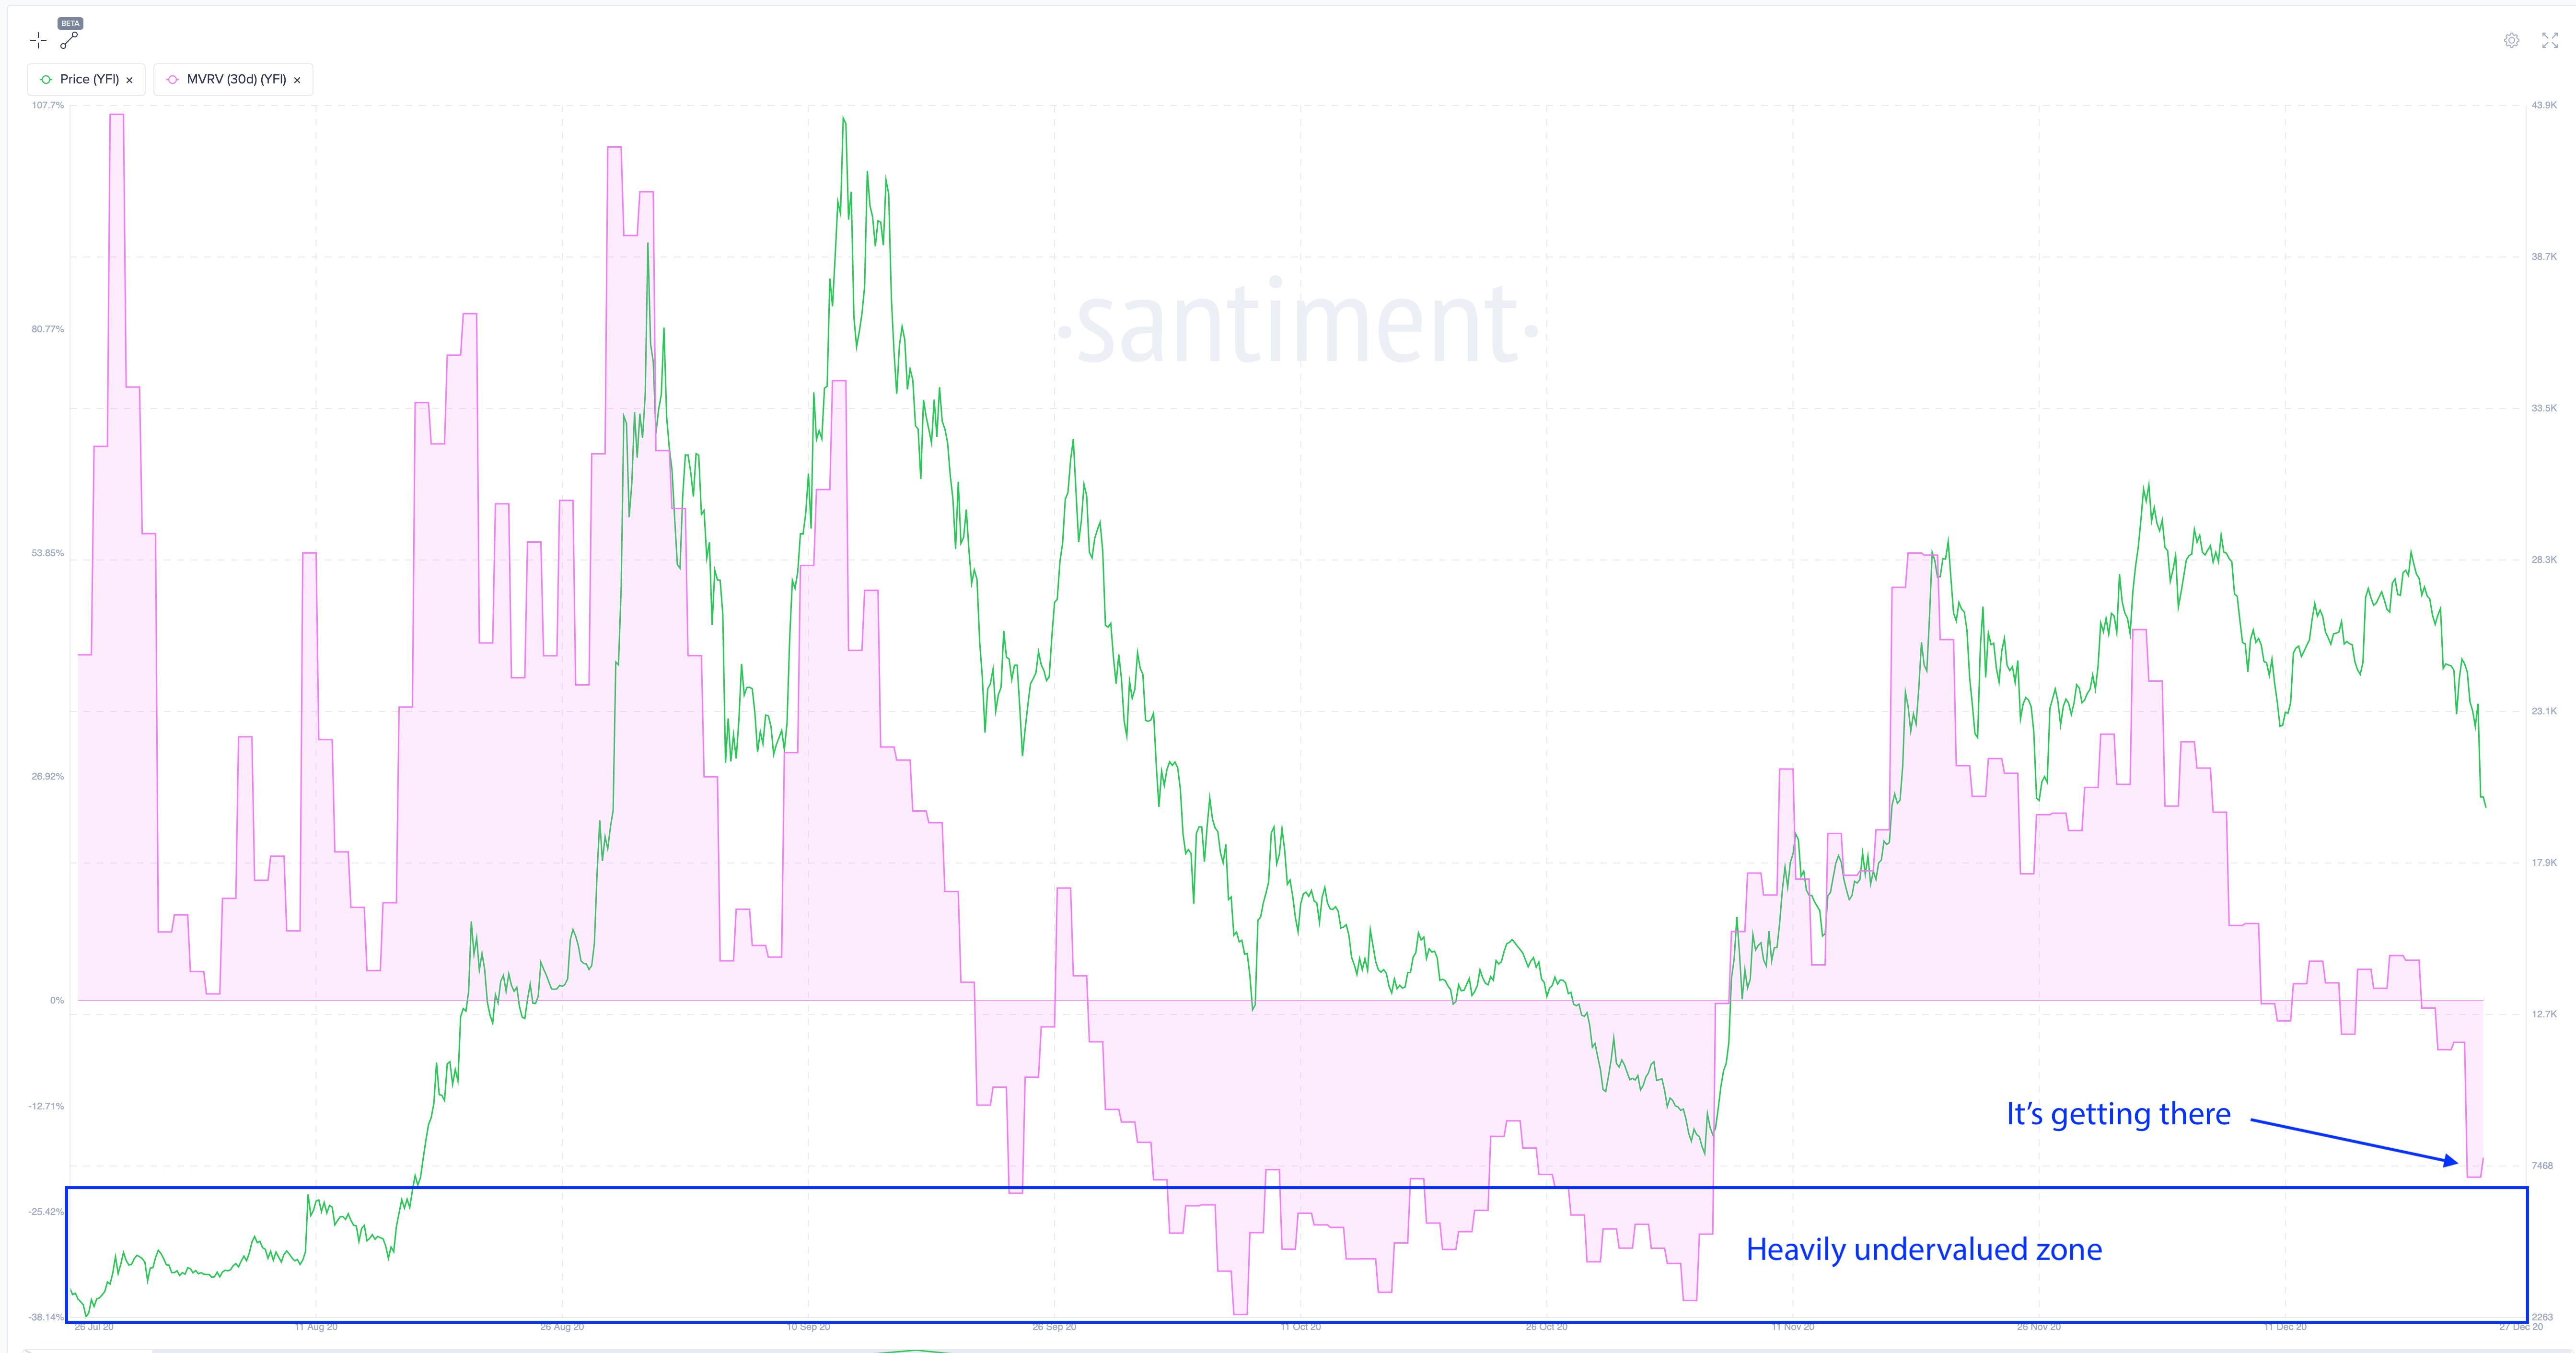
YFI MVRV 30D chart
If Yearn.Finance price drops to the 78.6% fib level at $12,000, it will put the digital asset into the heavily undervalued zone. It’s also important to note that the number of whales holding between 1,000 and 10,000 coins dropped by two in the past 48 hours.
%20[15.52.13,%2024%20Dec,%202020]-637444187215263790.png)
YFI Holders Distribution chart
Large investors could be waiting for Yearn.Finance price to dip lower before starting to buy as it seems that the exchange inflow of YFI coins has spiked again. This can be a potential indicator of the bottom. In the past, we have seen similar behavior that resulted in whales buying the dip at the beginning of November.
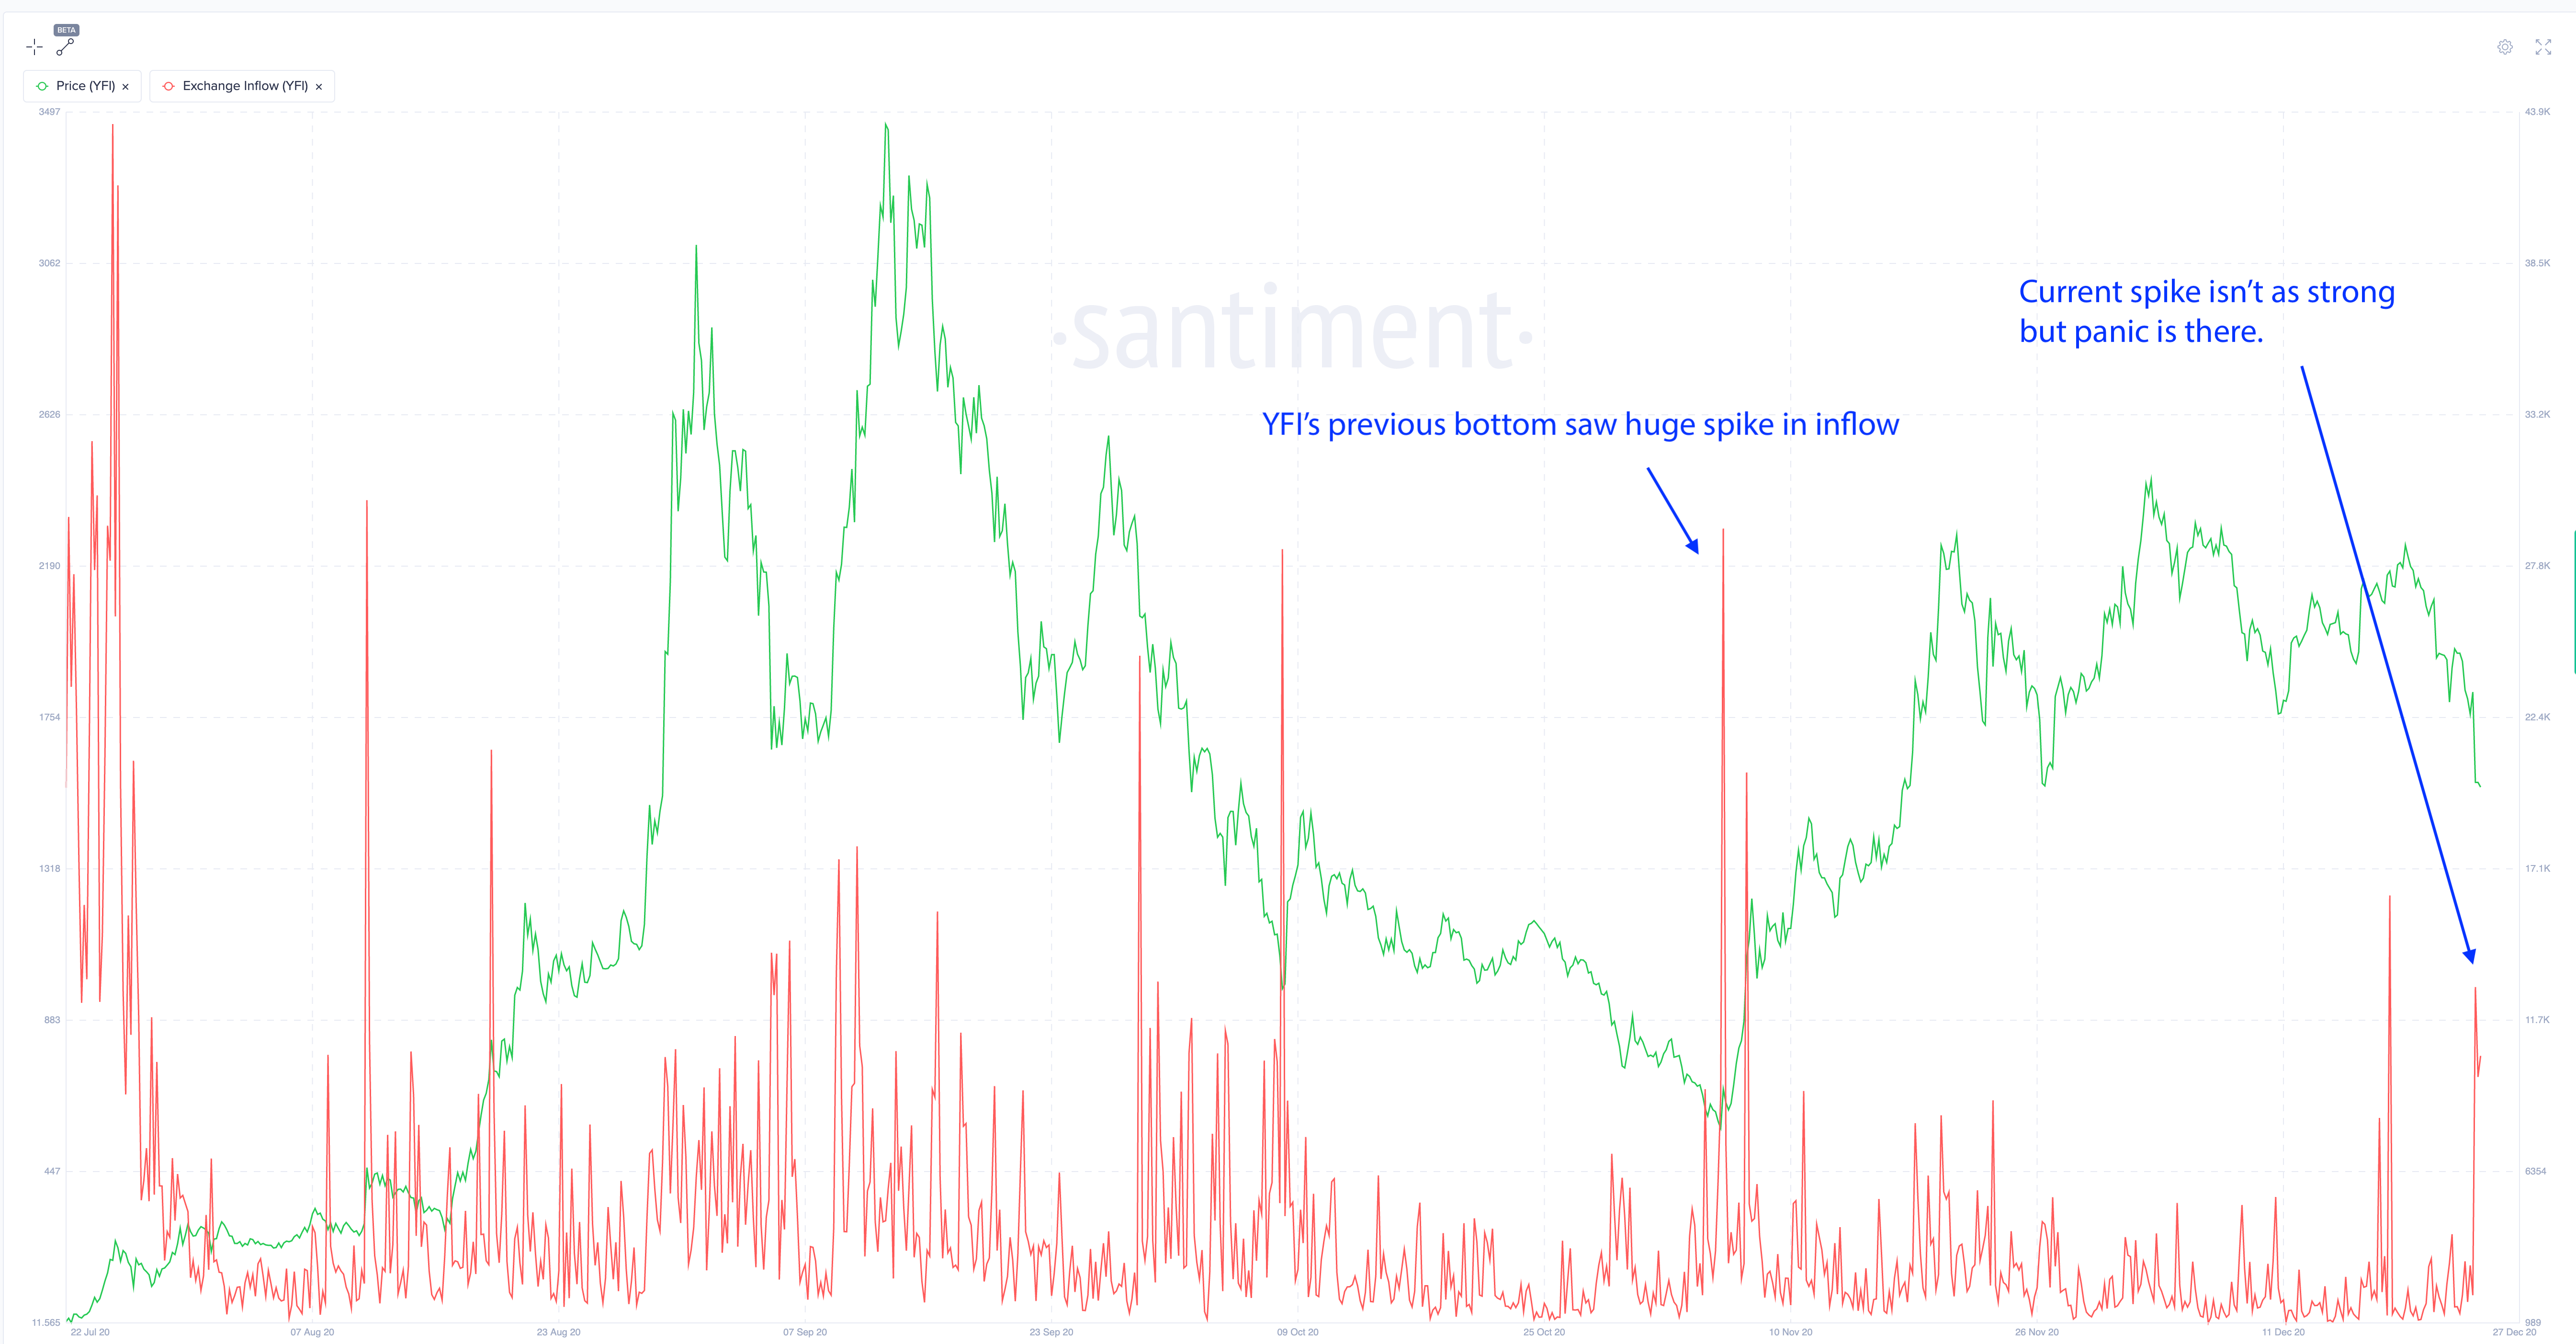
YFI Exchange Inflow
The In/Out of the Money Around Price (IOMAP) chart shows the most vital support area to be located between $18,064 and $18,703, coinciding with the 61.8% fib level, and basically no resistance to the upside.
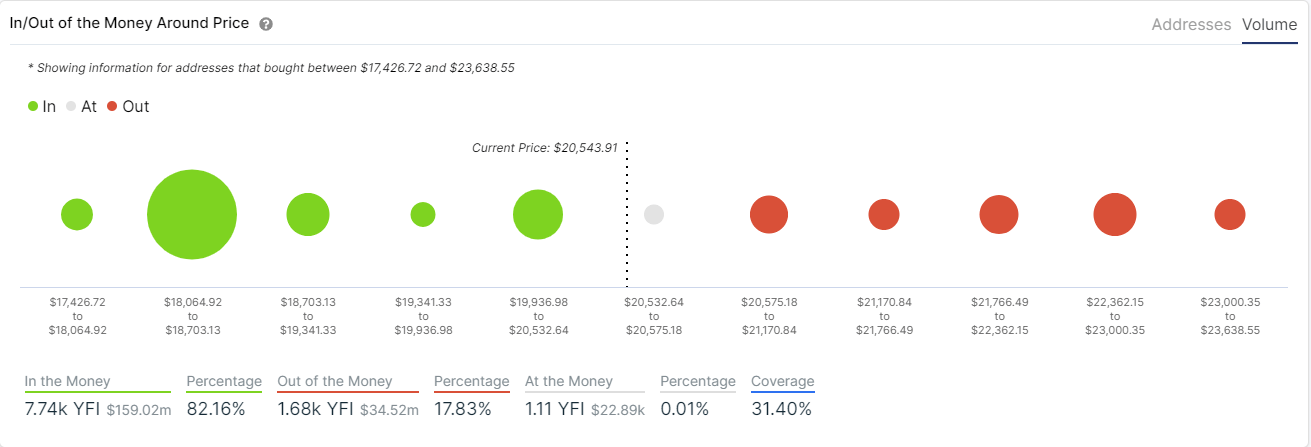
YFI IOMAP chart
On the 4-hour and 12-hour charts, the TD Sequential indicator has just presented two buy signals simultaneously, giving a lot of credence to the bullish outlook.
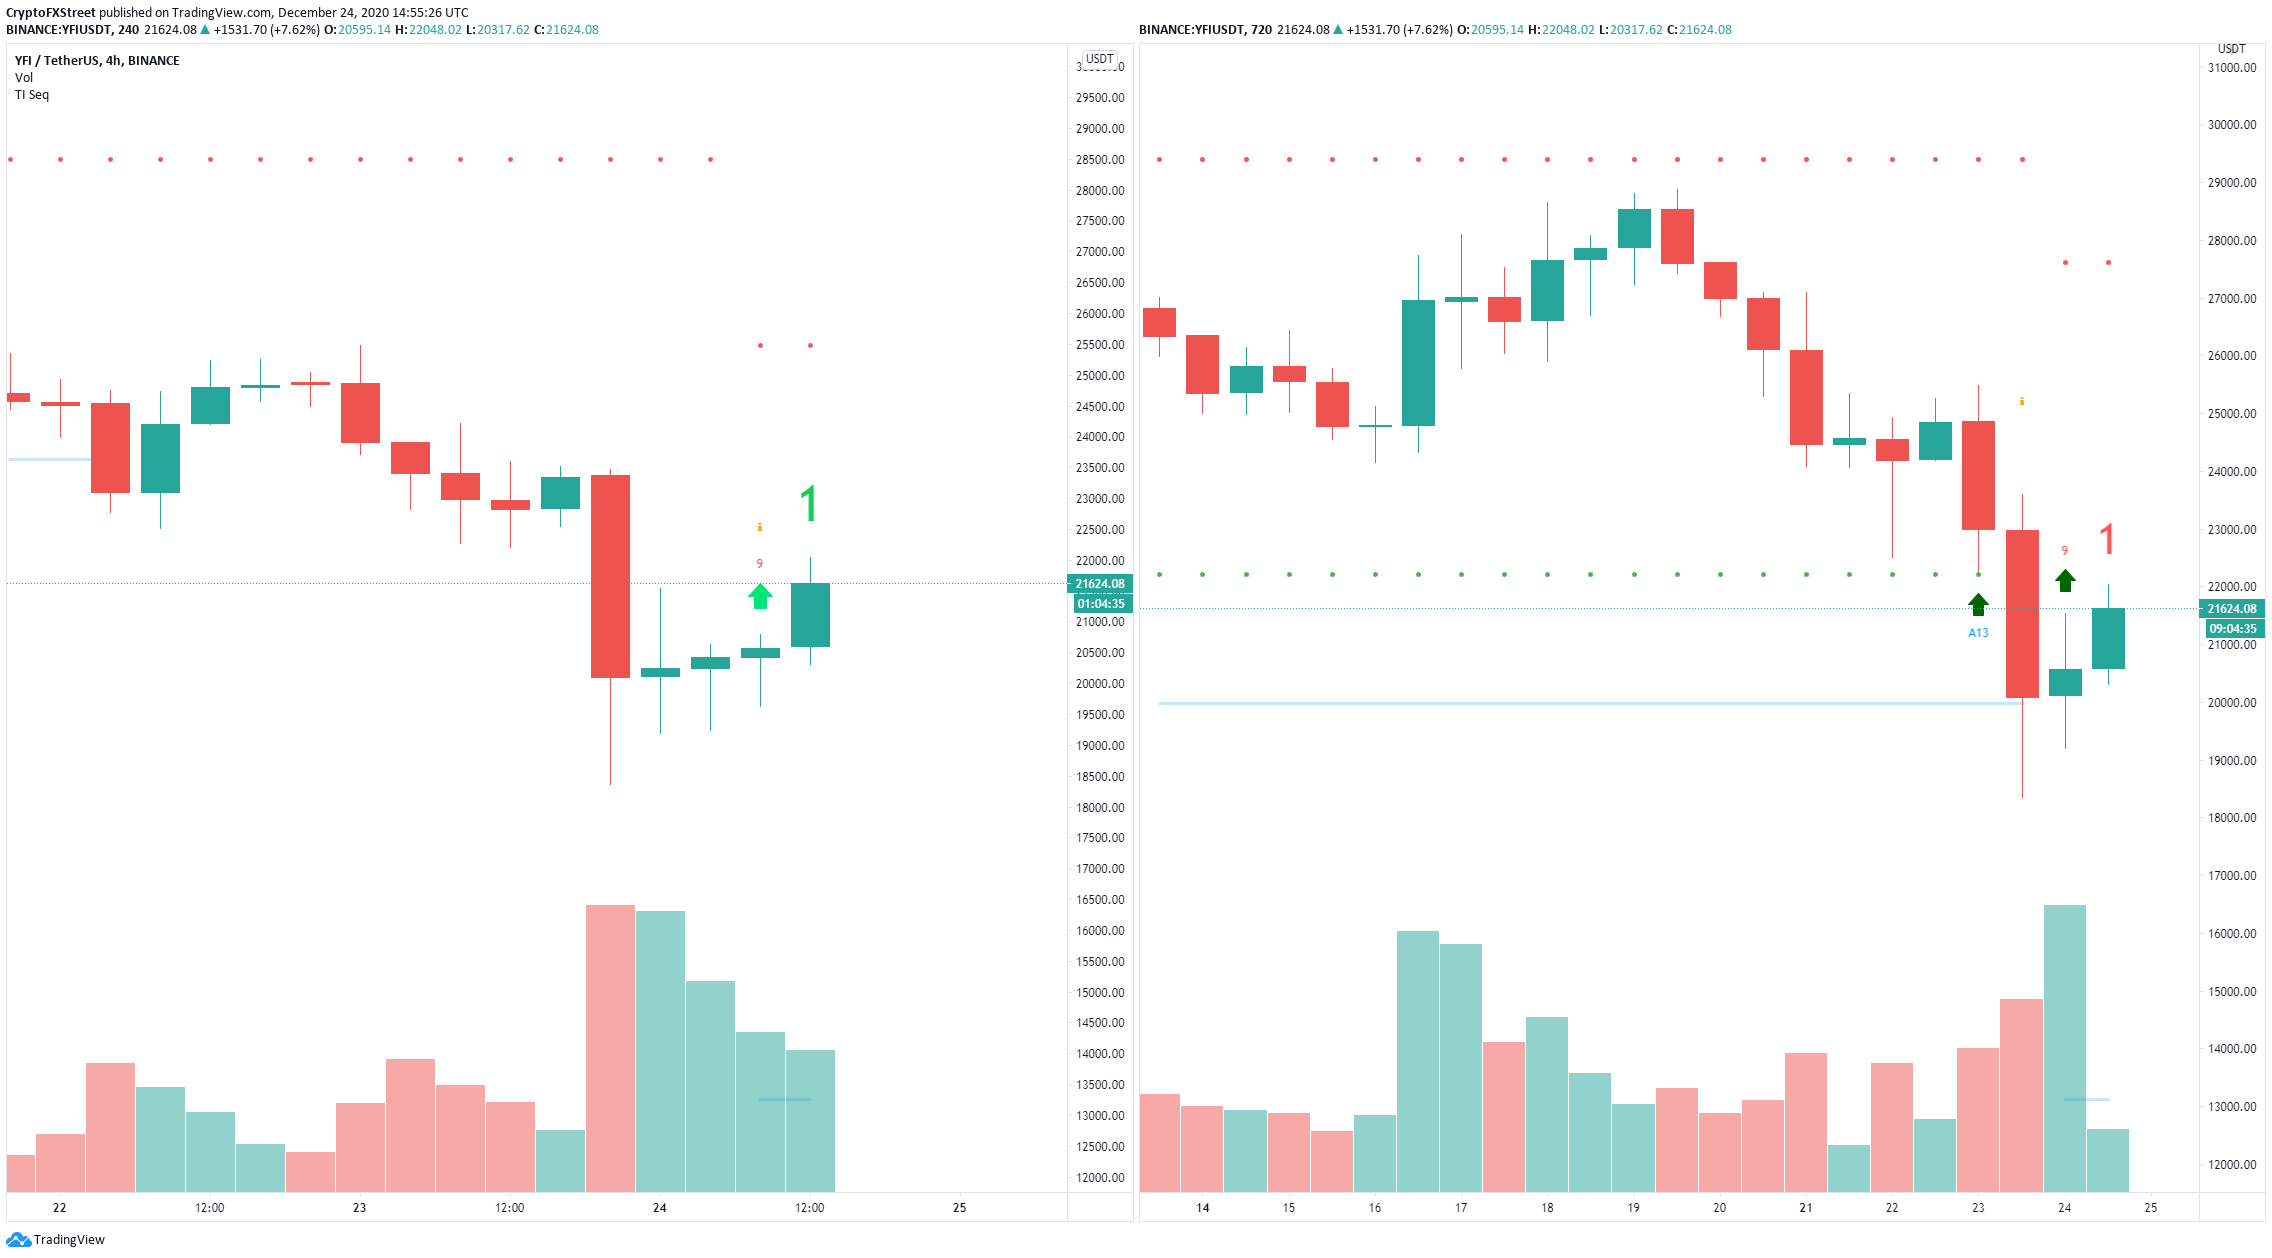
YFI 4-hour and 12-hour charts
Considering that the IOMAP chart shows very little resistance to the upside well until $24,000, a rebound above this level will invalidate the long-term bearish outlook.
Author

Lorenzo Stroe
Independent Analyst
Lorenzo is an experienced Technical Analyst and Content Writer who has been working in the cryptocurrency industry since 2012. He also has a passion for trading.


