Yearn.finance Price Forecast: YFI ready for a 50% comeback
- Yearn finance is looking forward to a descending wedge breakout eyeing $16,000.
- Various technical indexes support the bullish narrative, but the IOMAP hints at a robust resistance ahead.

Yearn.finance appears to have found the bottom that analysts have been anticipating in the recent past. The hunt for a market bottom comes after the decentralized finance (DeFi) darling token lost over 80% of its value from the all-time high at $44,000. Attempts to cushion YFI from the devastating breakdown were futile as bears overpowered the bulls.
Yearn.finance bulls regain control
Meanwhile, Yearn.finance seems to have encountered robust buyer congestion at $7,250. The token is changing hands at $8,830 amid a developing bullish momentum. The bullish outlook is given credibility by the descending wedge pattern on the 12-hour chart.
The wedge pattern helps identify a precise reversal point after an asset has been in an extended downtrend like YFI. If the ongoing bullish action breaks above the wedge, Yearn.finance could resume the uptrend targeting highs of $16,000
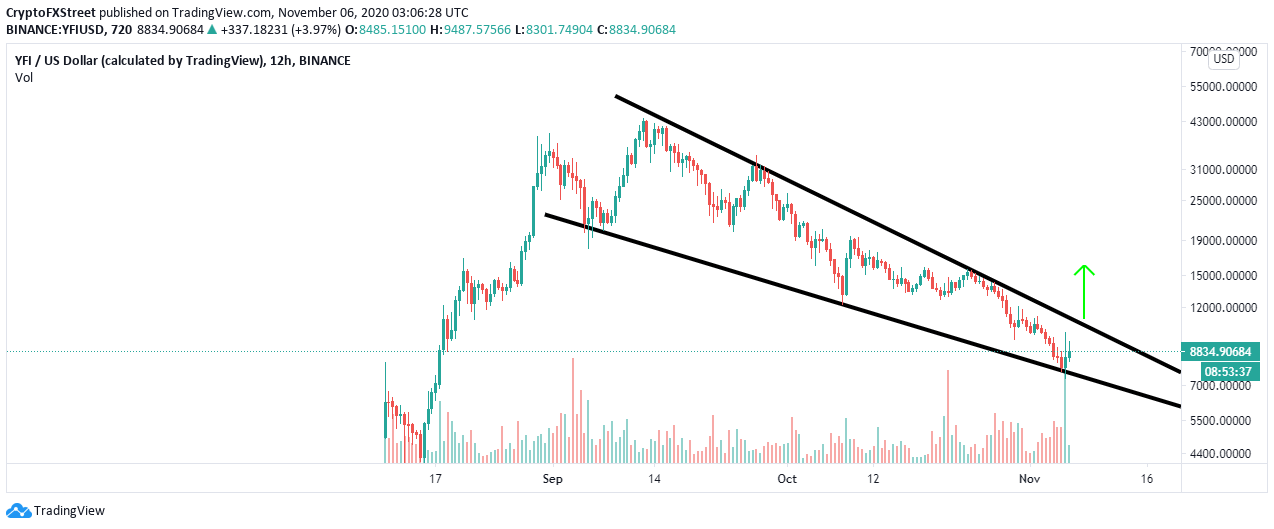
YFI/USD 12-hour chart
The Relative Strength Index on the 12-hour chart shows that the bullish grip is becoming stronger. Besides, the crypto had hit oversold conditions, calling for a reversal. A bullish divergence formed by the RSI also adds weight to the bullish narrative.
It is worth noting that bullish divergences occur when the price makes a series of lower lows while the price prints a series of higher lows. For instance, the RSI on the 4-hour chart began the divergence just before November. Similarly, the divergence does not show an exact point of entry for buy orders, but it helps to highlight an asset’s dwindling downtrend.
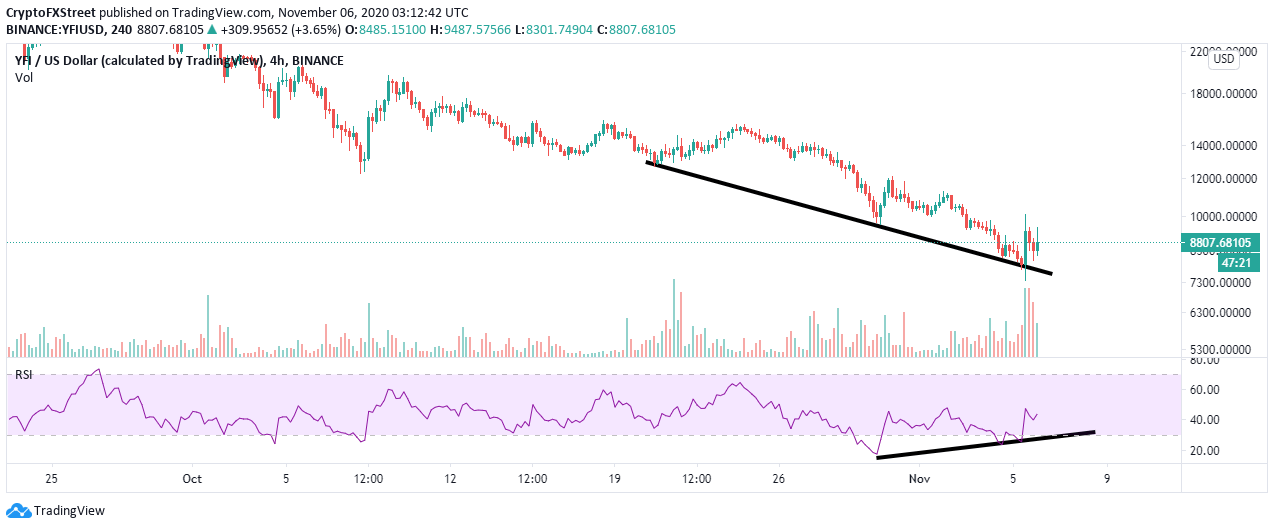
YFI/USD 4-hour chart
Looking at the other side of the fence, IntoTheBlock’s IOMAP model reveals an intense resistance ahead of Yearn.finance. This robust seller congestion zone runs from $8,875 to $9,130. Here, 669 addresses previously bought roughly 4,800 YFI. It is doubtful that YFI/USD will pierce through this range, hence the likelihood of the developing buying pressure being absorbed and delaying the breakout to $16,000.
-637402304452329424.png)
Yearn.finance IOMAP chart
On the downside, the absence of a stout support zone hints at a potential reversal becoming disastrous. The only formidable support lies between $8,066 and $8,321. Previously, three addresses bought approximately 12.6 YFI. In other words, the bulls need to focus on pulling the crypto above $10,000; otherwise, a breakdown from the current market level could be nerve-shattering.
Author

John Isige
FXStreet
John Isige is a seasoned cryptocurrency journalist and markets analyst committed to delivering high-quality, actionable insights tailored to traders, investors, and crypto enthusiasts. He enjoys deep dives into emerging Web3 tren


