XRP price signals breakout, Ripple bulls to eye 20% rally soon
- XRP price has breached a nearly 450-day declining trend line, indicating a bullish resurgence.
- Investors can expect the remittance token to retest the 200-week SMA at $0.493.
- A daily candlestick close below the EMA confluence at $0.379 will invalidate the bullish thesis for Ripple.

XRP price shows a clear sign of a bullish move which comes after months of rejection combined with massive sell-offs. However, the narrative has finally shifted after this recent breakout of a declining trendline, forecasting an explosive move soon.
XRP price ready to make hay
XRP price produced six distinctive lower highs since November 11, 2021. A trendline drawn connecting these swing points reveals that it prevented the altcoin from moving higher. However, the upswing journey that began after January 3 has overcome two critical hurdles - the confluence of 50-day, 100-day and 200-day Exponential Moving Averages (EMAs) at roughly $0.370 and the $0.390 resistance level that has persisted for the last 260 days.
This development signaled a pivot from a bearish outlook to a bullish one. It also ended the sideways movement as it breached the aforementioned declining trend line. Now, XRP price needs to hold above $0.400 to kick-start its upswing.
The first and the most crucial target for XRP price is the 200-week Simple Moving Average (SMA) at $0.493. Beyond this level, the remittance token could retest the $0.596 hurdle, bringing the total gain from 20% to 40%.
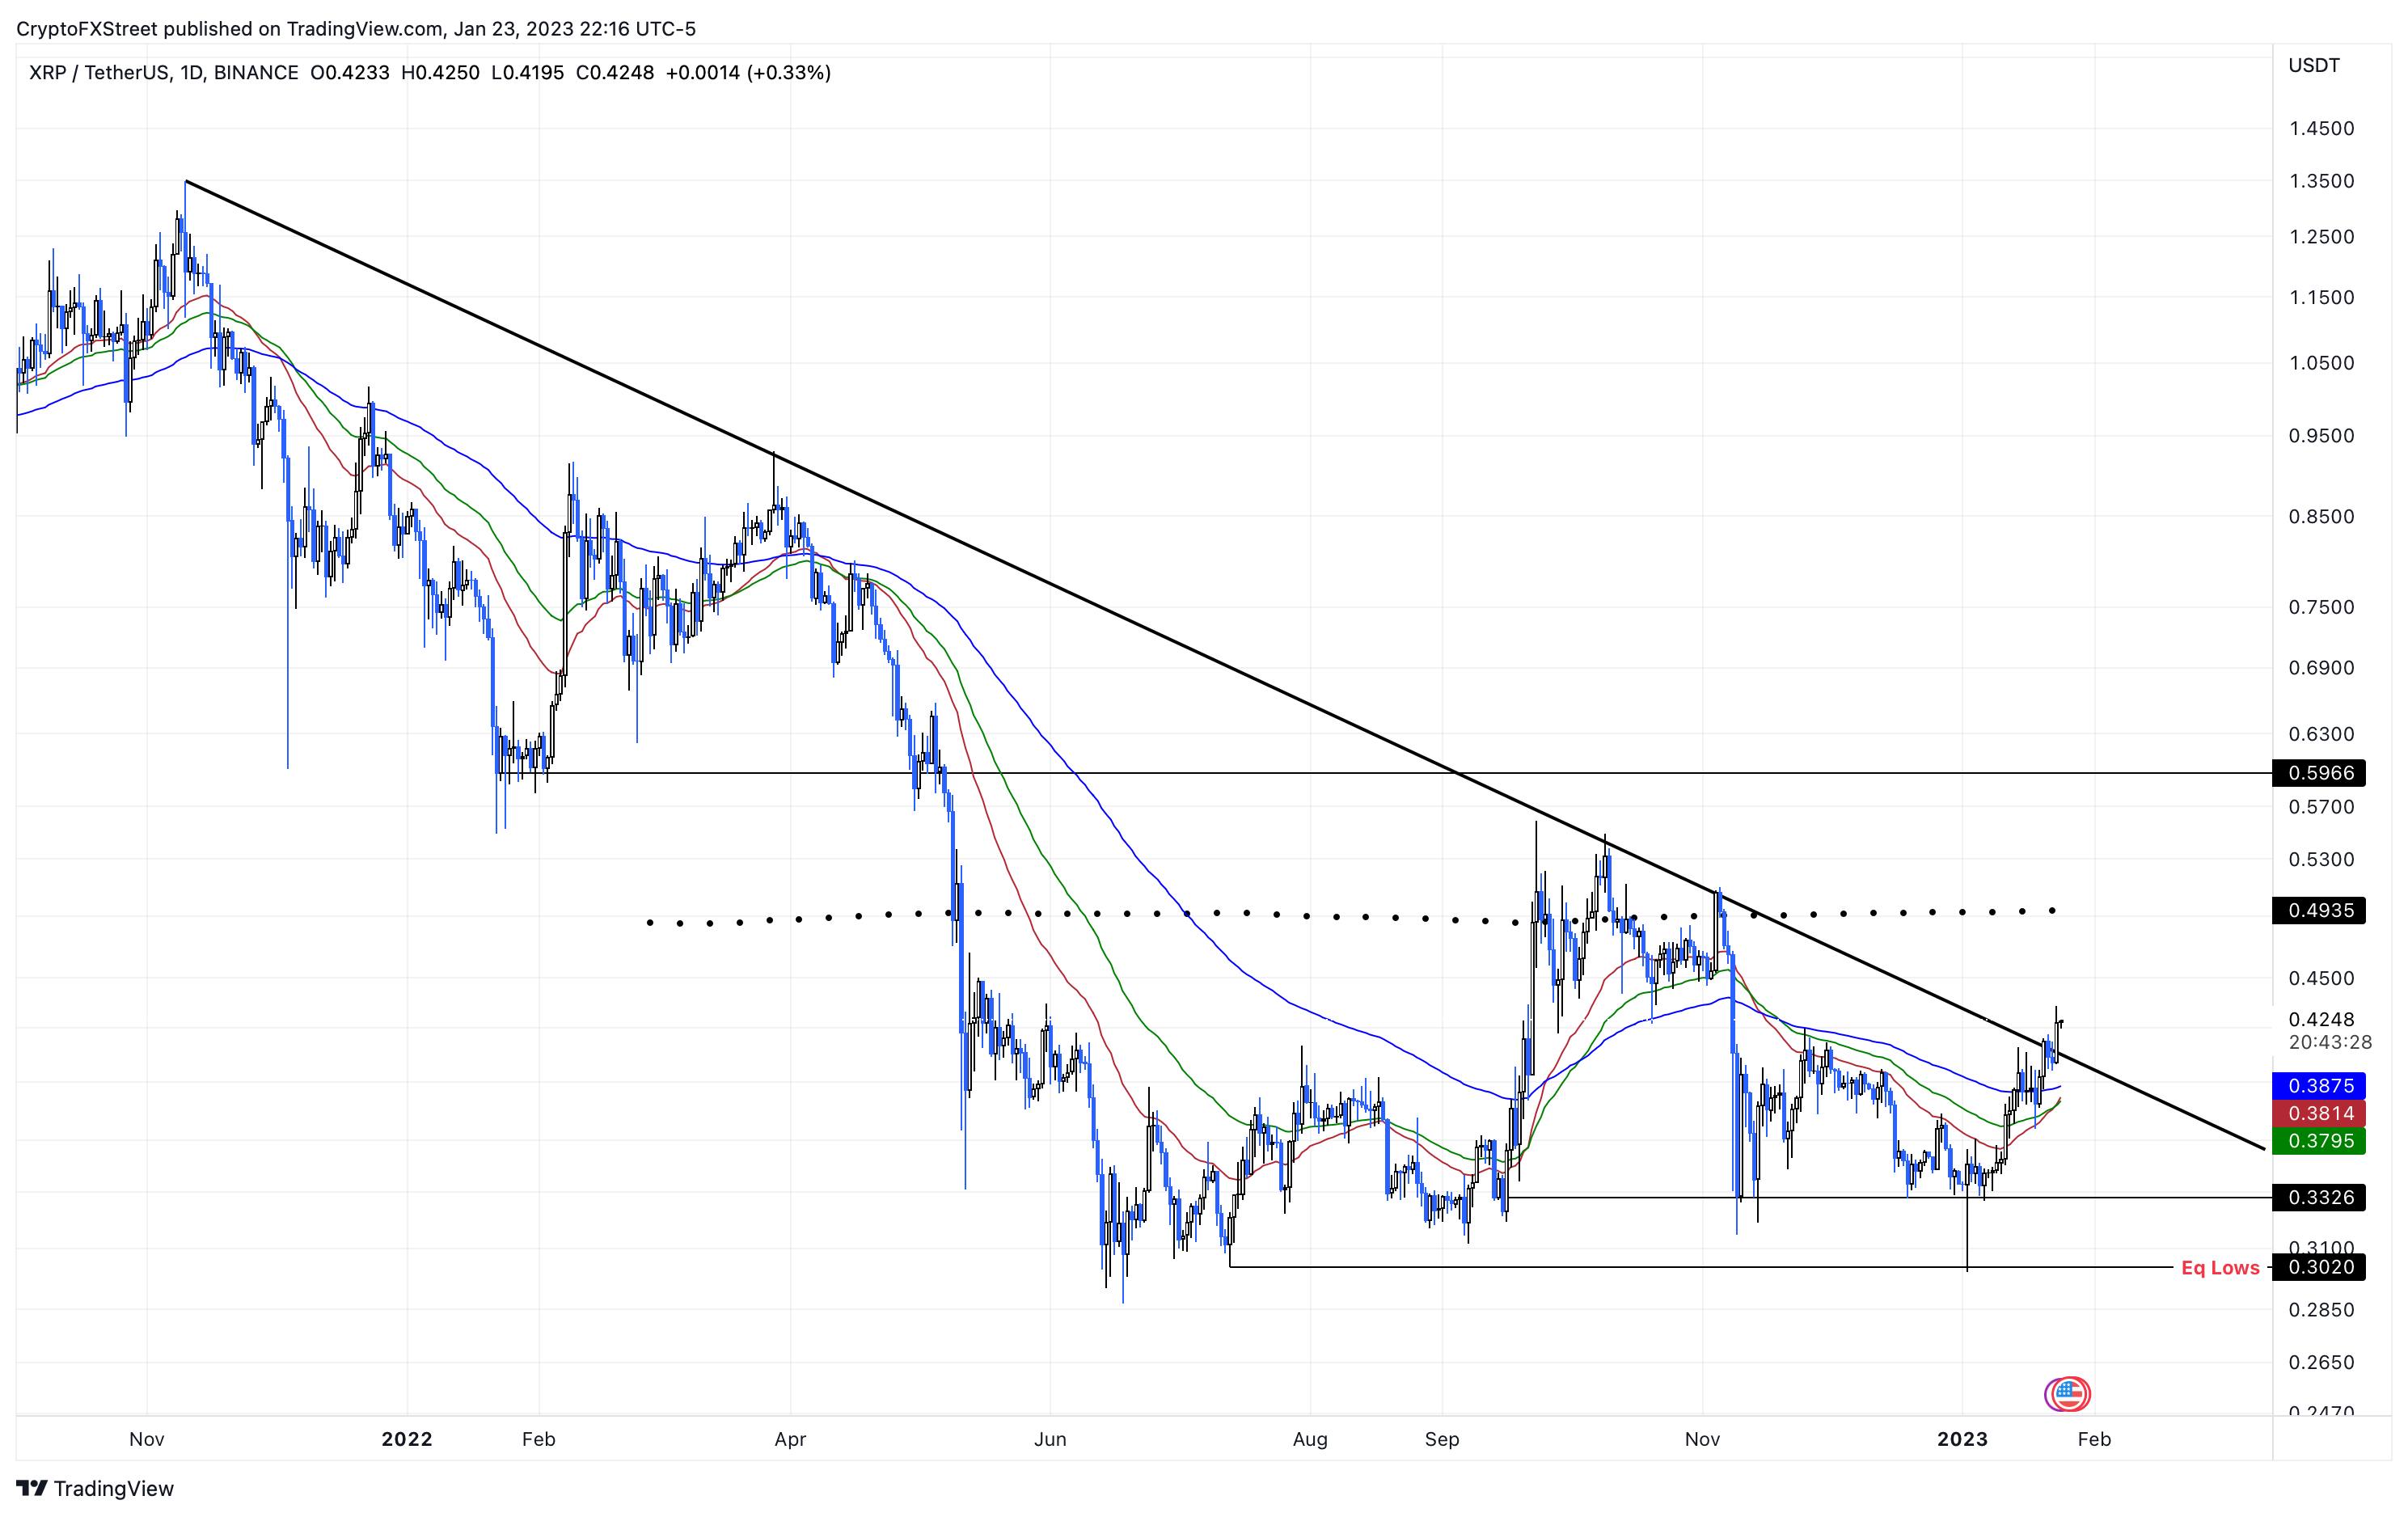
XRP/USDT 1-day chart
While the outlook for XRP price is no doubt bullish, market participants need to cut their bags should the altcoin sink below the declining trend line. The main reason behind this line of thinking is that the market seems overextended, especially with Bitcoin and Ethereum developing bearish divergence on daily time frames.
Furthermore, confirmation of the bullish thesis invalidation will occur if XRP price produces a daily candlestick close below $0.379. In such a case, the remittance token could slide lower to retest the $0.332 support floor.
Author

Akash Girimath
FXStreet
Akash Girimath is a Mechanical Engineer interested in the chaos of the financial markets. Trying to make sense of this convoluted yet fascinating space, he switched his engineering job to become a crypto reporter and analyst.


