XRP price renews optimism as Ripple bulls gather strength to kick-start recovery
- XRP price is lagging behind other cryptocurrencies as Bitcoin has long since begun its rally recording higher highs.
- The bulls’ inability to push prices higher resulted in XRP price crashing 10% on October 18.
- However, a crucial indicator suggests that Ripple may have recorded a local bottom.

XRP price has crashed 14% from its swing high at $1.18 recorded on October 16, tagging the downside trend line of the prevailing chart pattern. While Ripple (XRP) was at the edge of dropping below $1, a key technical indicator hints that the swing low may have set the local bottom for the time being.
XRP price prints local bottom
XRP price has been locked within a descending parallel channel on the 4-hour chart, as Ripple continues to record lower highs and lower lows. Although the token is sealed in a consolidation pattern, the Momentum Reversal Indicator (MRI) has flashed a bottom signal, suggesting that it is ready for a move higher.
The technical pattern suggests that Ripple could oscillate between the upper and lower boundaries of the channel before revealing bigger directional intentions. Following the drop toward the downside trend line of the chart pattern, XRP price would likely tag the topside trend line at $1.17 next.
The first obstacle for XRP price is at the middle boundary of the prevailing chart pattern at $1.09, coinciding with the 100 four-hour Simple Moving Average (SMA). Another hurdle will emerge at the 50% Fibonacci retracement level at $1.13, which sits near the 20 and 50 four-hour SMAs.
The last roadblock may materialize at the resistance line given by the MRI at $1.14 before XRP price is able to tag its short-term bullish target at $1.17. Should a spike in buy orders materialize, Ripple may slice above the parallel channel, tagging the 61.8% Fibonacci retracement level at $1.19. If the bulls manage to flip this level into support, the token may aim to target $1.28, where the breakout line, 78.6 Fibonacci retracement level and the declining resistance trend line meet.
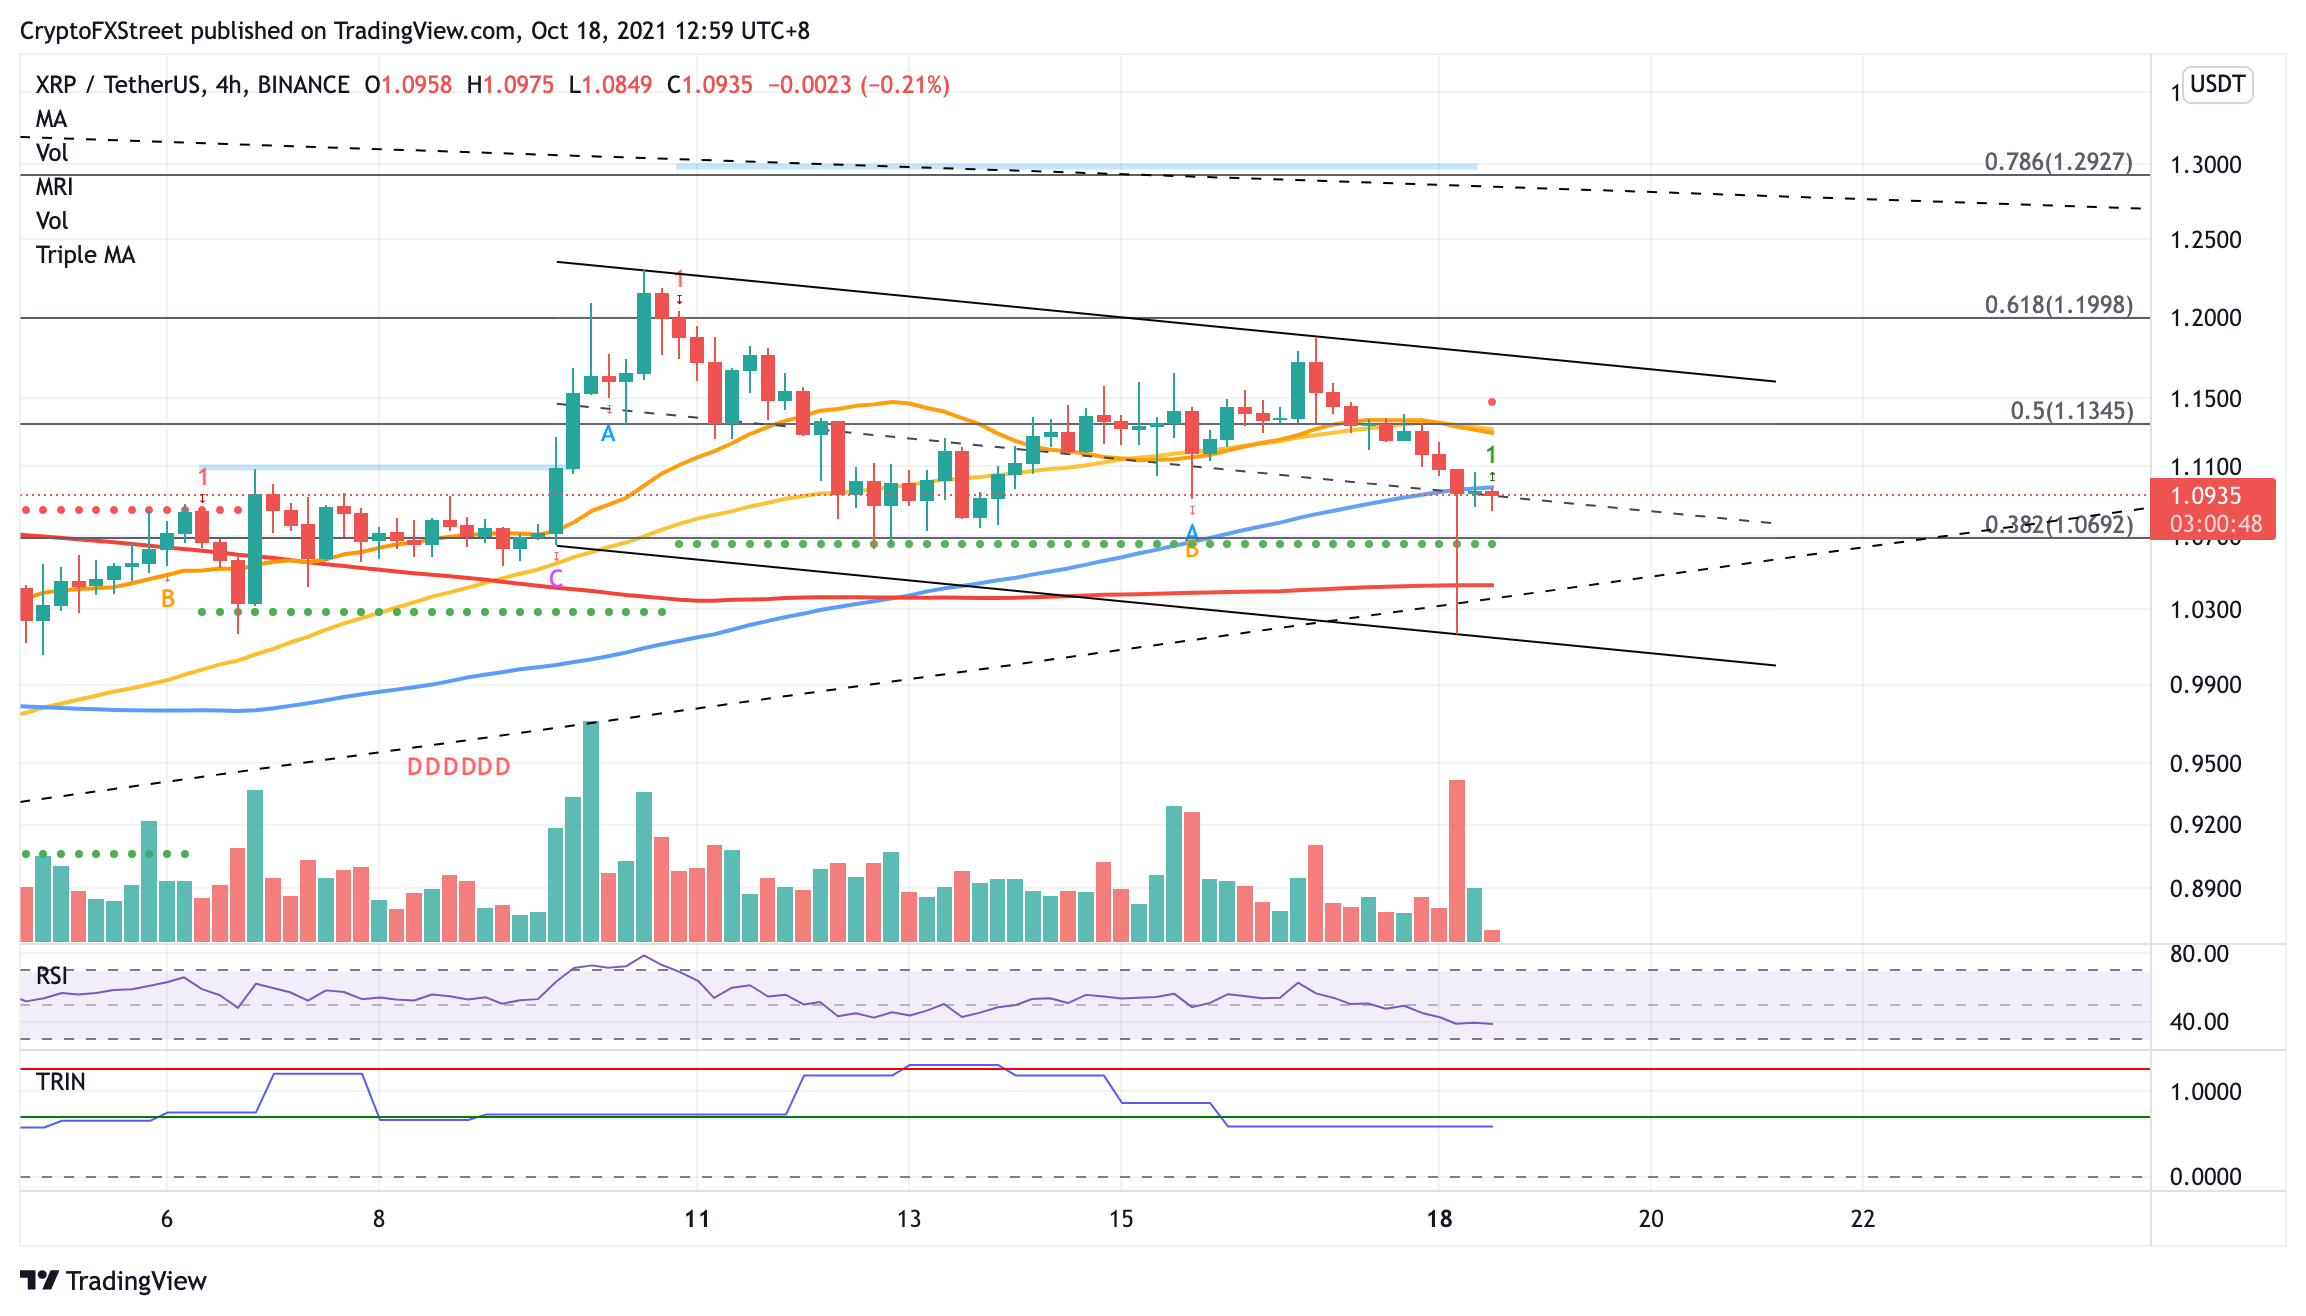
XRP/USDT 4-hour chart
However, should selling pressure increase, XRP price may retest key support levels before revealing targets on the upside. The first line of defense for Ripple is at the 38.2% Fibonacci retracement level at $1.06, coinciding with the support line given by the MRI.
Additional lines of defense may emerge at the 200 four-hour SMA at $1.04, then at the ascending support trend line that formed since July 20 at $1.03. Slicing below this multi-month foothold could spell trouble for the bulls, but the last leg of support will appear at the downside trend line of the parallel channel at $1.01.
Until Ripple bulls can break above the governing technical pattern, the token may continue to trend lower until XRP price reveals decisive directional intentions.
Author

Sarah Tran
Independent Analyst
Sarah has closely followed the growth of blockchain technology and its adoption since 2016.


