Top 3 Price Prediction Bitcoin, Ethereum, XRP: Cryptos test support, long-term bullish outlook remains
- Bitcoin price faces selling pressure after bearish US CPI data.
- Ethereum price has developed a powerful buy signal on its Point and Figure chart.
- XRP price converts into a bull market despite recent selling pressure.

Bitcoin price dropped below a critical Ichimoku level, but the pullback is likely only a return to equilibrium within the Ichimoku Kinko Hyo system. Ethereum price faced the same selling pressure as the rest of the cryptocurrency market, but the drop has now set up ETH with a powerful buying signal. XRP price outperformed BTC and ETH for the first time in nearly fifteen months.
Bitcoin price returns below the Cloud, Ichimoku gap-fill incoming
Bitcoin price has spent seven days with a significant gap between the bodies of the daily candlesticks and the Tenkan-Sen. This is significant because gaps between candlestick bodies and the Tenkan-Sen don't often last long – often correcting back to each other in four to six periods.
This 'gap-fill between the candlestick bodies and the Tenkan-Sen returns to equilibrium in the Ichimoku system. There are two methods in which this return to equilibrium occurs; the first is by price action returning to the Tenkan-Sen. The second and rarest is a return to equilibrium over time. In that scenario, Bitcoin price generally trades sideways, and the Tenkan-Sen slowly returns to price over time.
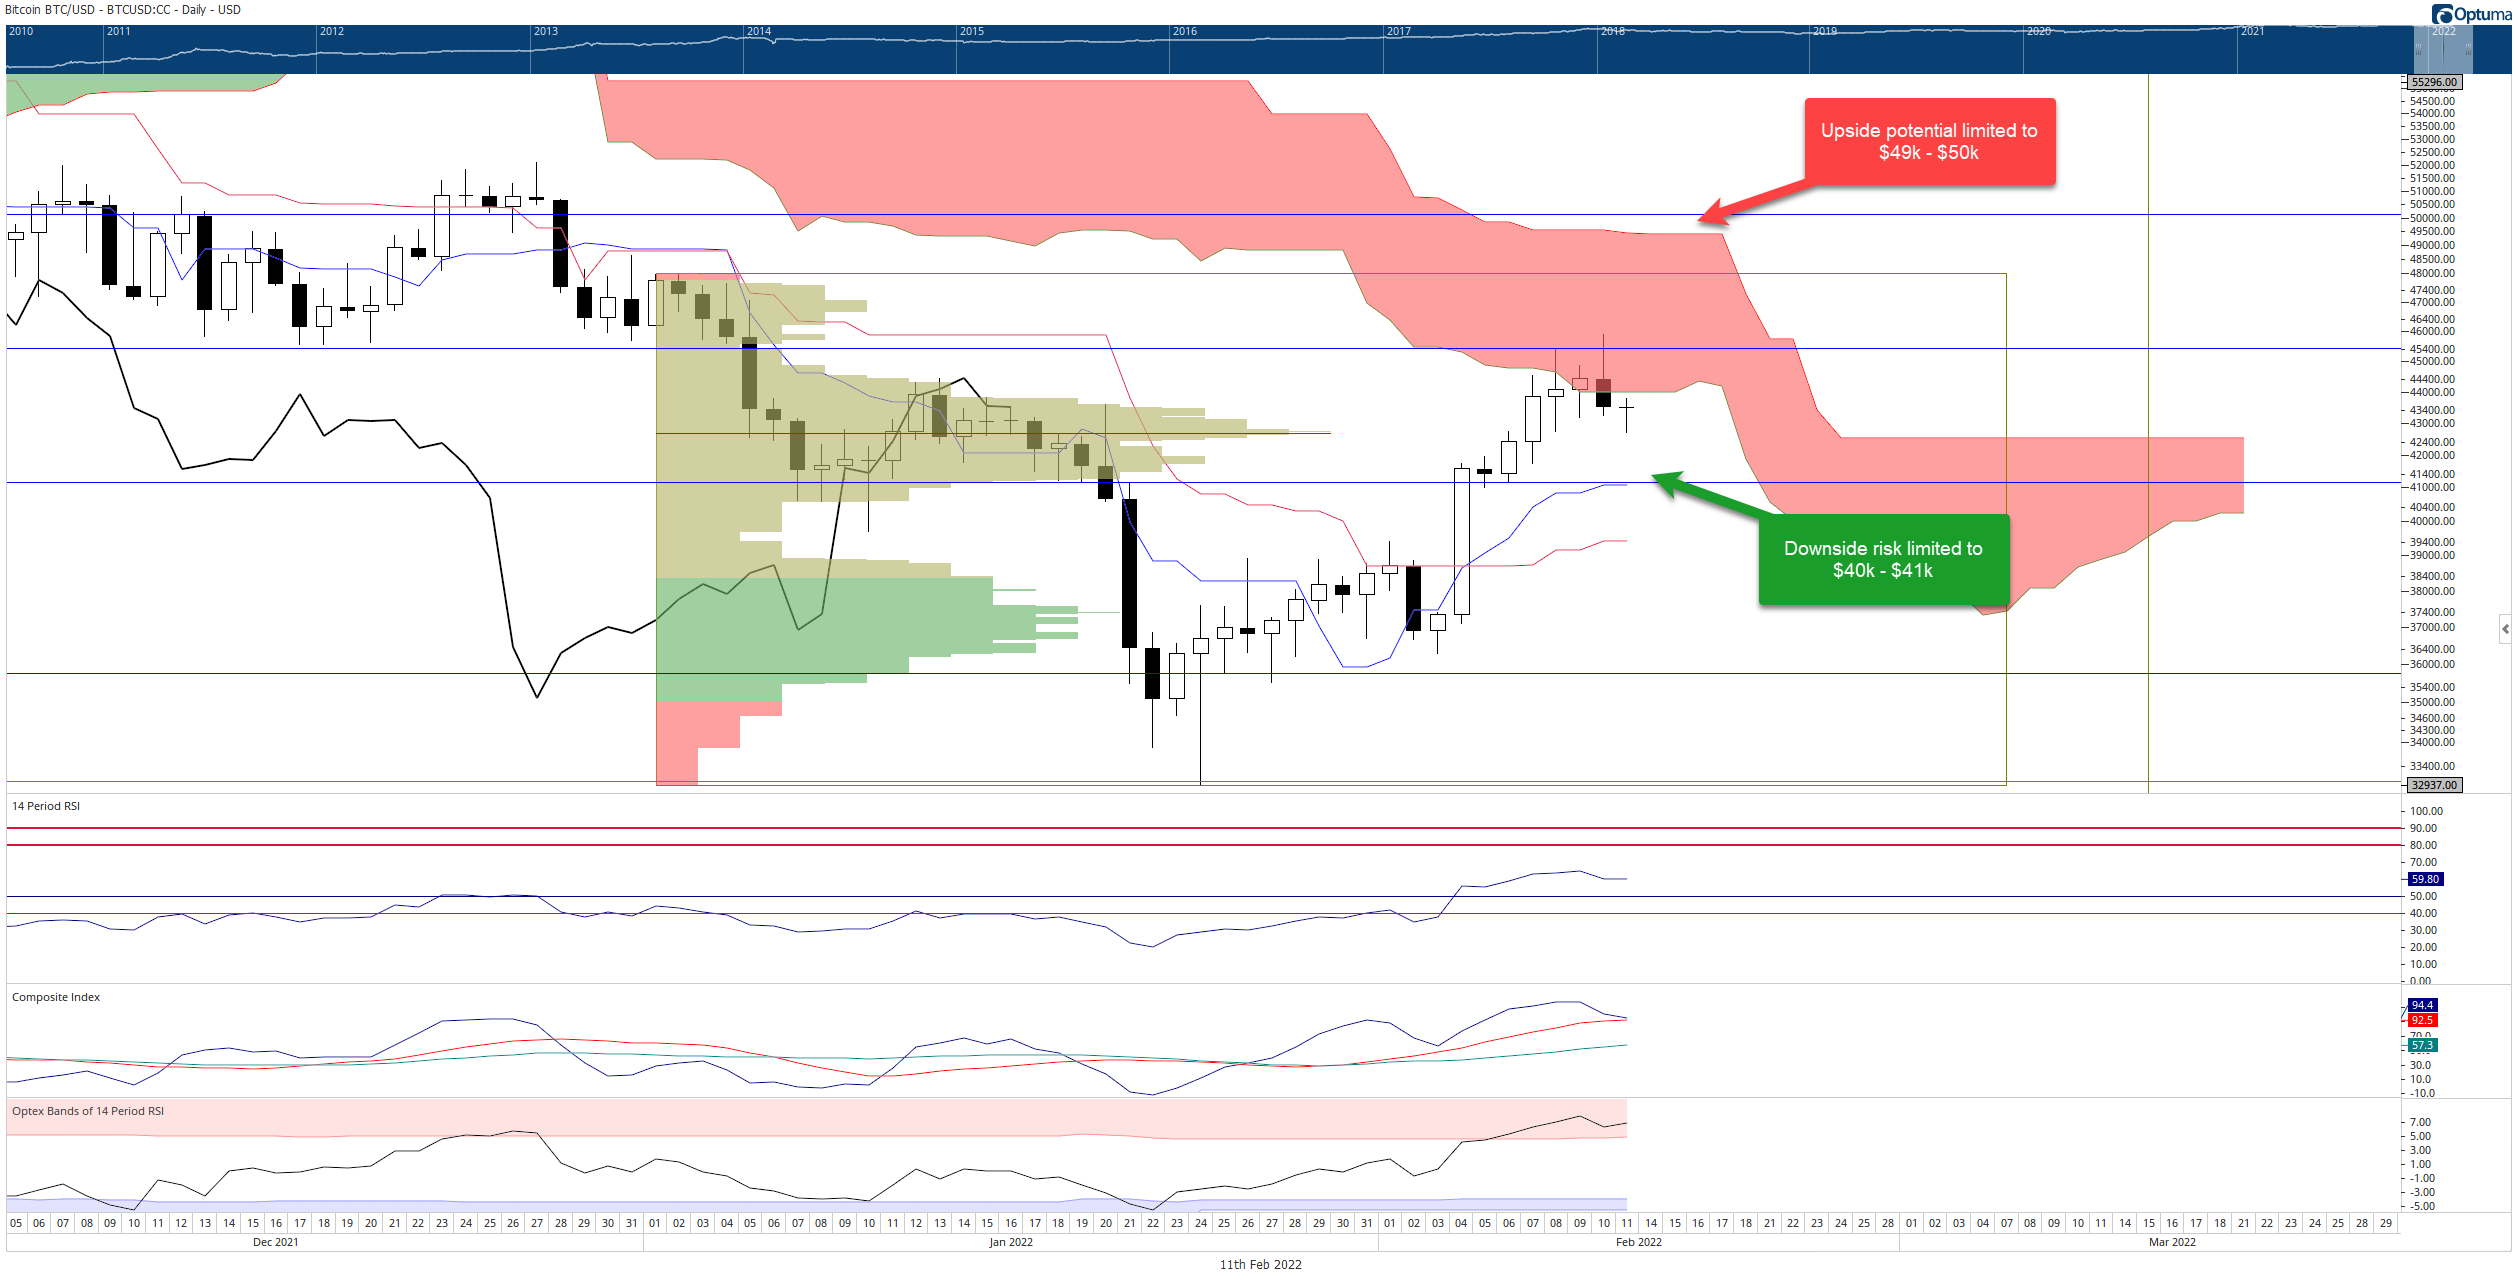
BTC/USD Daily Ichimoku Kinko Hyo Chart
The two scenarios for Bitcoin price are either a sideways trading range between $43,000 and $44,000 or a return to the Tenken-Sen at $41,000. $41,000 should be the maximum downside risk until next week. If there is bullish participation over the weekend, the upside potential will likely be limited to the top of the Ichimoku Cloud near the $49,000 to $50,000 value areas.
Ethereum price drop turns into bullish trade setup
Ethereum price was hit hard on Thursday after the CPI data – but nearly all risk-on assets were smashed lower. However, Ethereum's price action forms a trading opportunity that its peers have yet to display: a bullish continuation setup.
There is a hypothetical buy entry setup on Ethereum's $50/3-box reversal Point and Figure chart. The setup is a buy stop order at $3,350, a stop loss at $3,150, and a profit target at $4,400. The trade represents a 5.25:1 reward/risk with an implied profit target of 32% post entry.
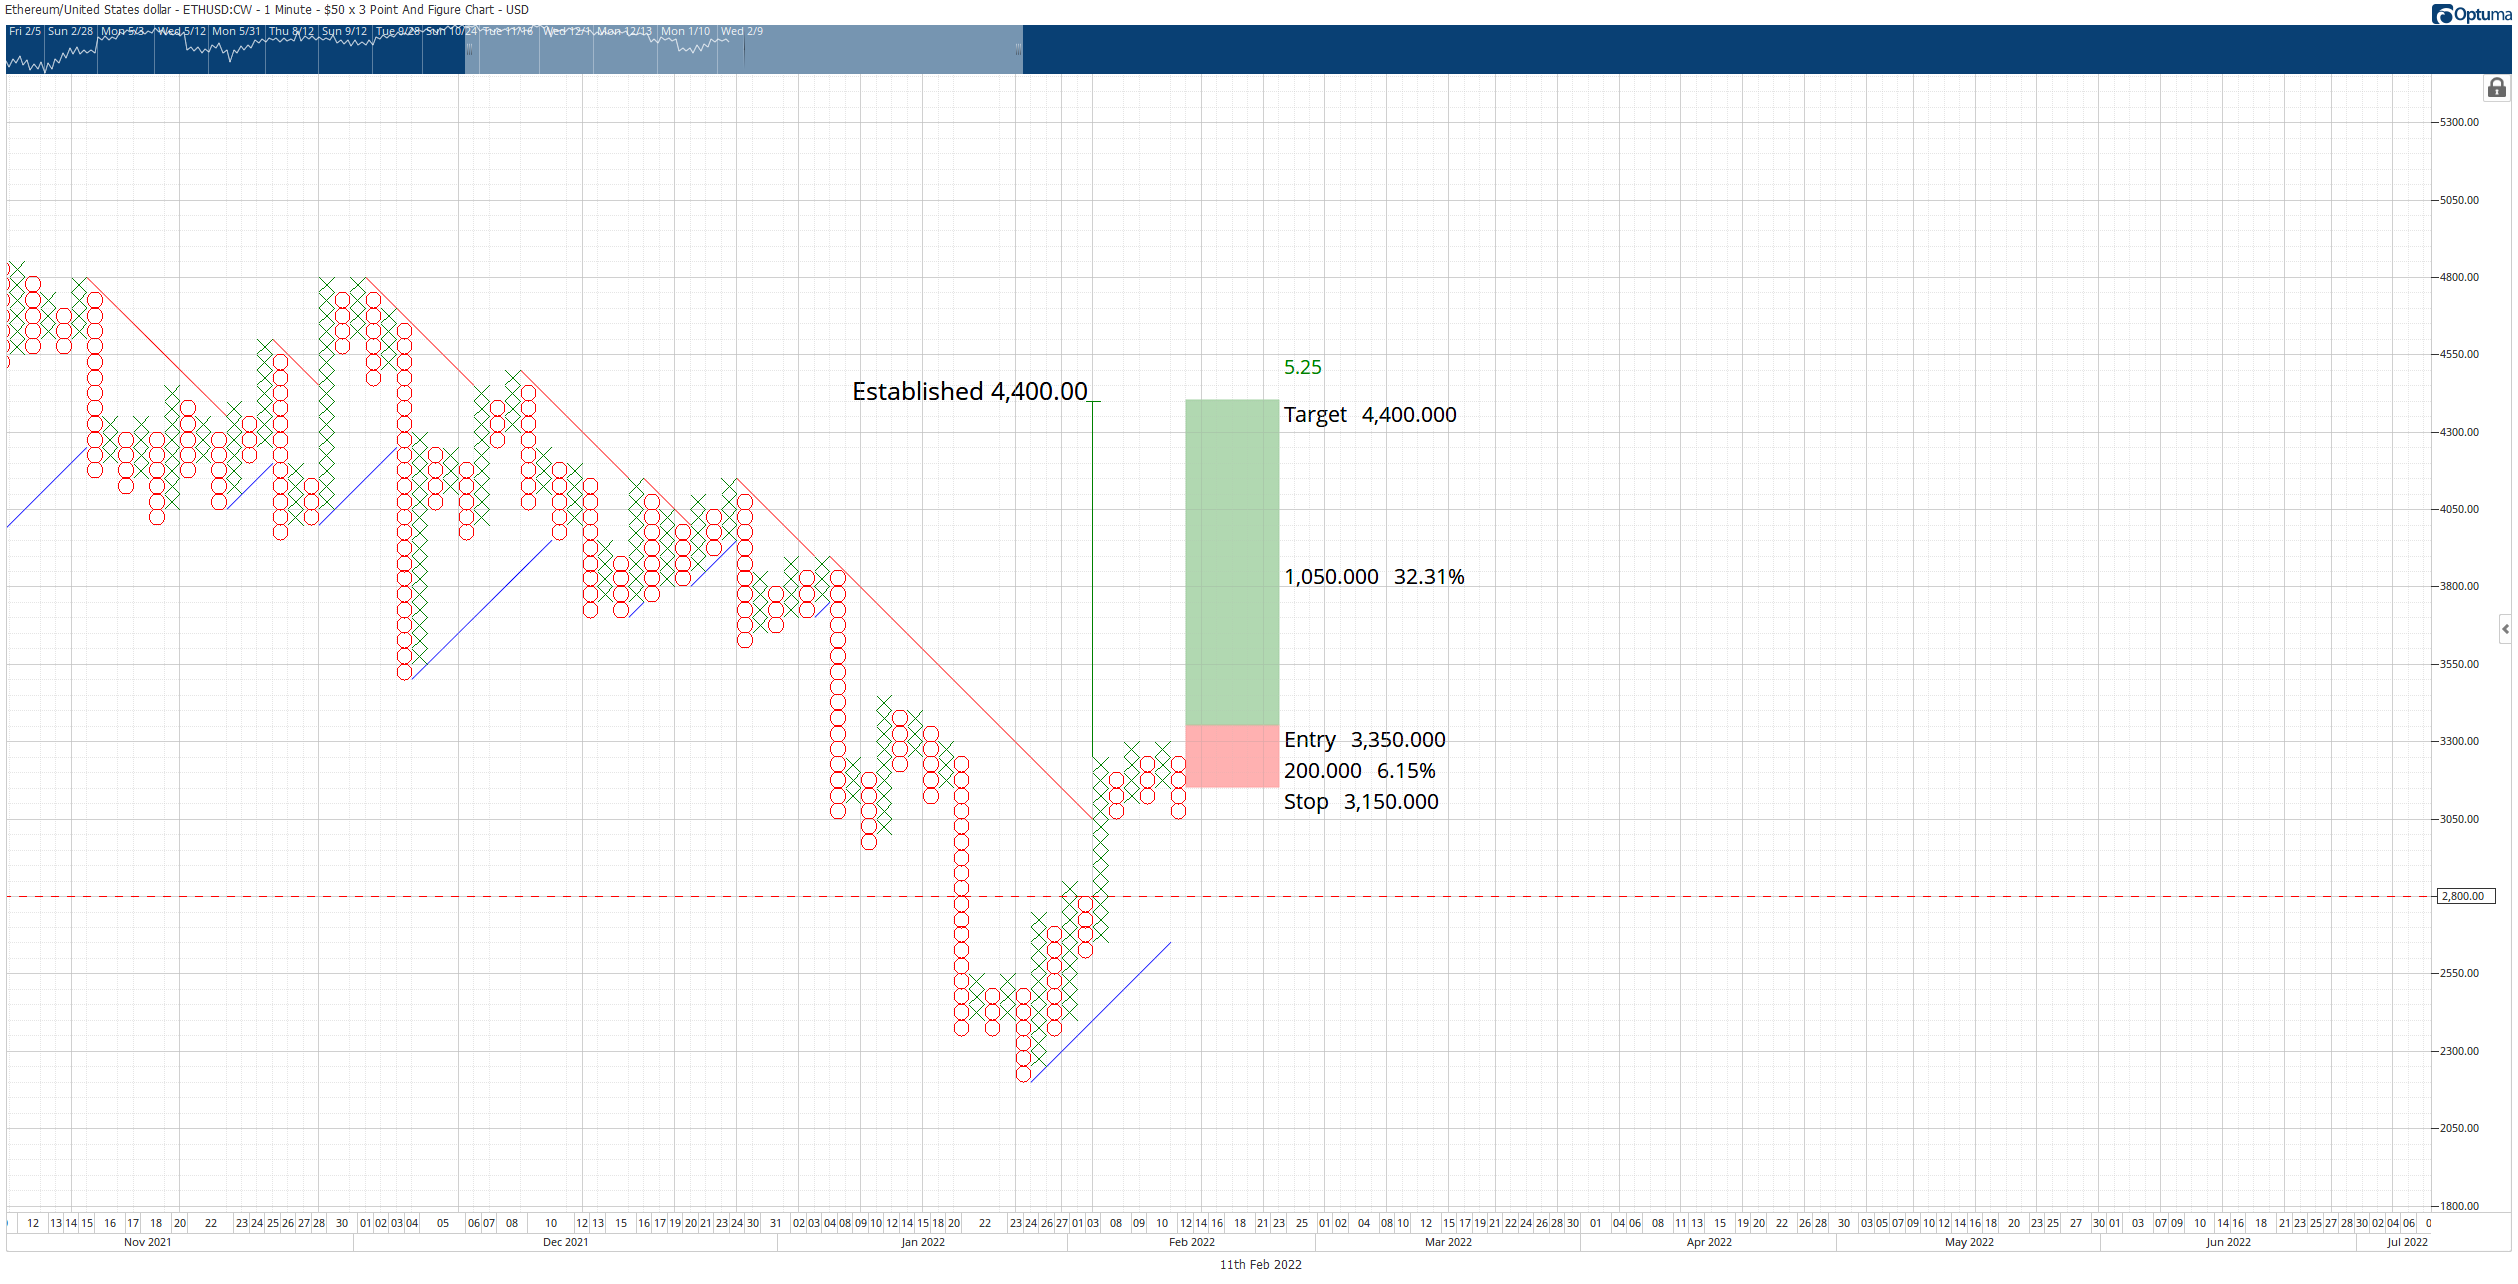
ETH/USD $50/3-box Reversal Point and Figure Chart
What makes this hypothetical long entry so enviable is the combination of Point and Figure patterns that enhance the likelihood of a profitable setup. The entry confirms two bullish patterns: Triple-Top Breakout and a Bear Trap. Ideally, Ethereum price would print one more O at $3,000 and create a Bearish Fakeout setup.
If Ethereum price prints an O below $3,000, the buying opportunity is invalidated for Ethereum price.
XRP price breaks a bear market trendline, return Ripple to bull mode
XRP price recently broke the bear market trendline on its $0.02/3-box reversal Point and Figure chart. That break occurred when XRP tagged the $0.92 price level, but it promptly sold off from there. The resulting price action is very similar to Ethereum's – almost exact.
While the pattern on the Point and Figure chart looks like the same Triple Top Breakout and Bear Trap setup, it is augmented slightly due to the current O-column being the first reversal column after converting to a bull market. The entry, therefore, is on the three-box reversal, not the breakout above the Triple Top pattern.
The theoretical long opportunity is a buy stop order at the three-box reversal, presently at $0.88. The stop loss is a four-box stop, and the profit target is near the most recent dominant trend line at $1.14. If XRP price moves lower, the entry and stop-loss follow in tandem.
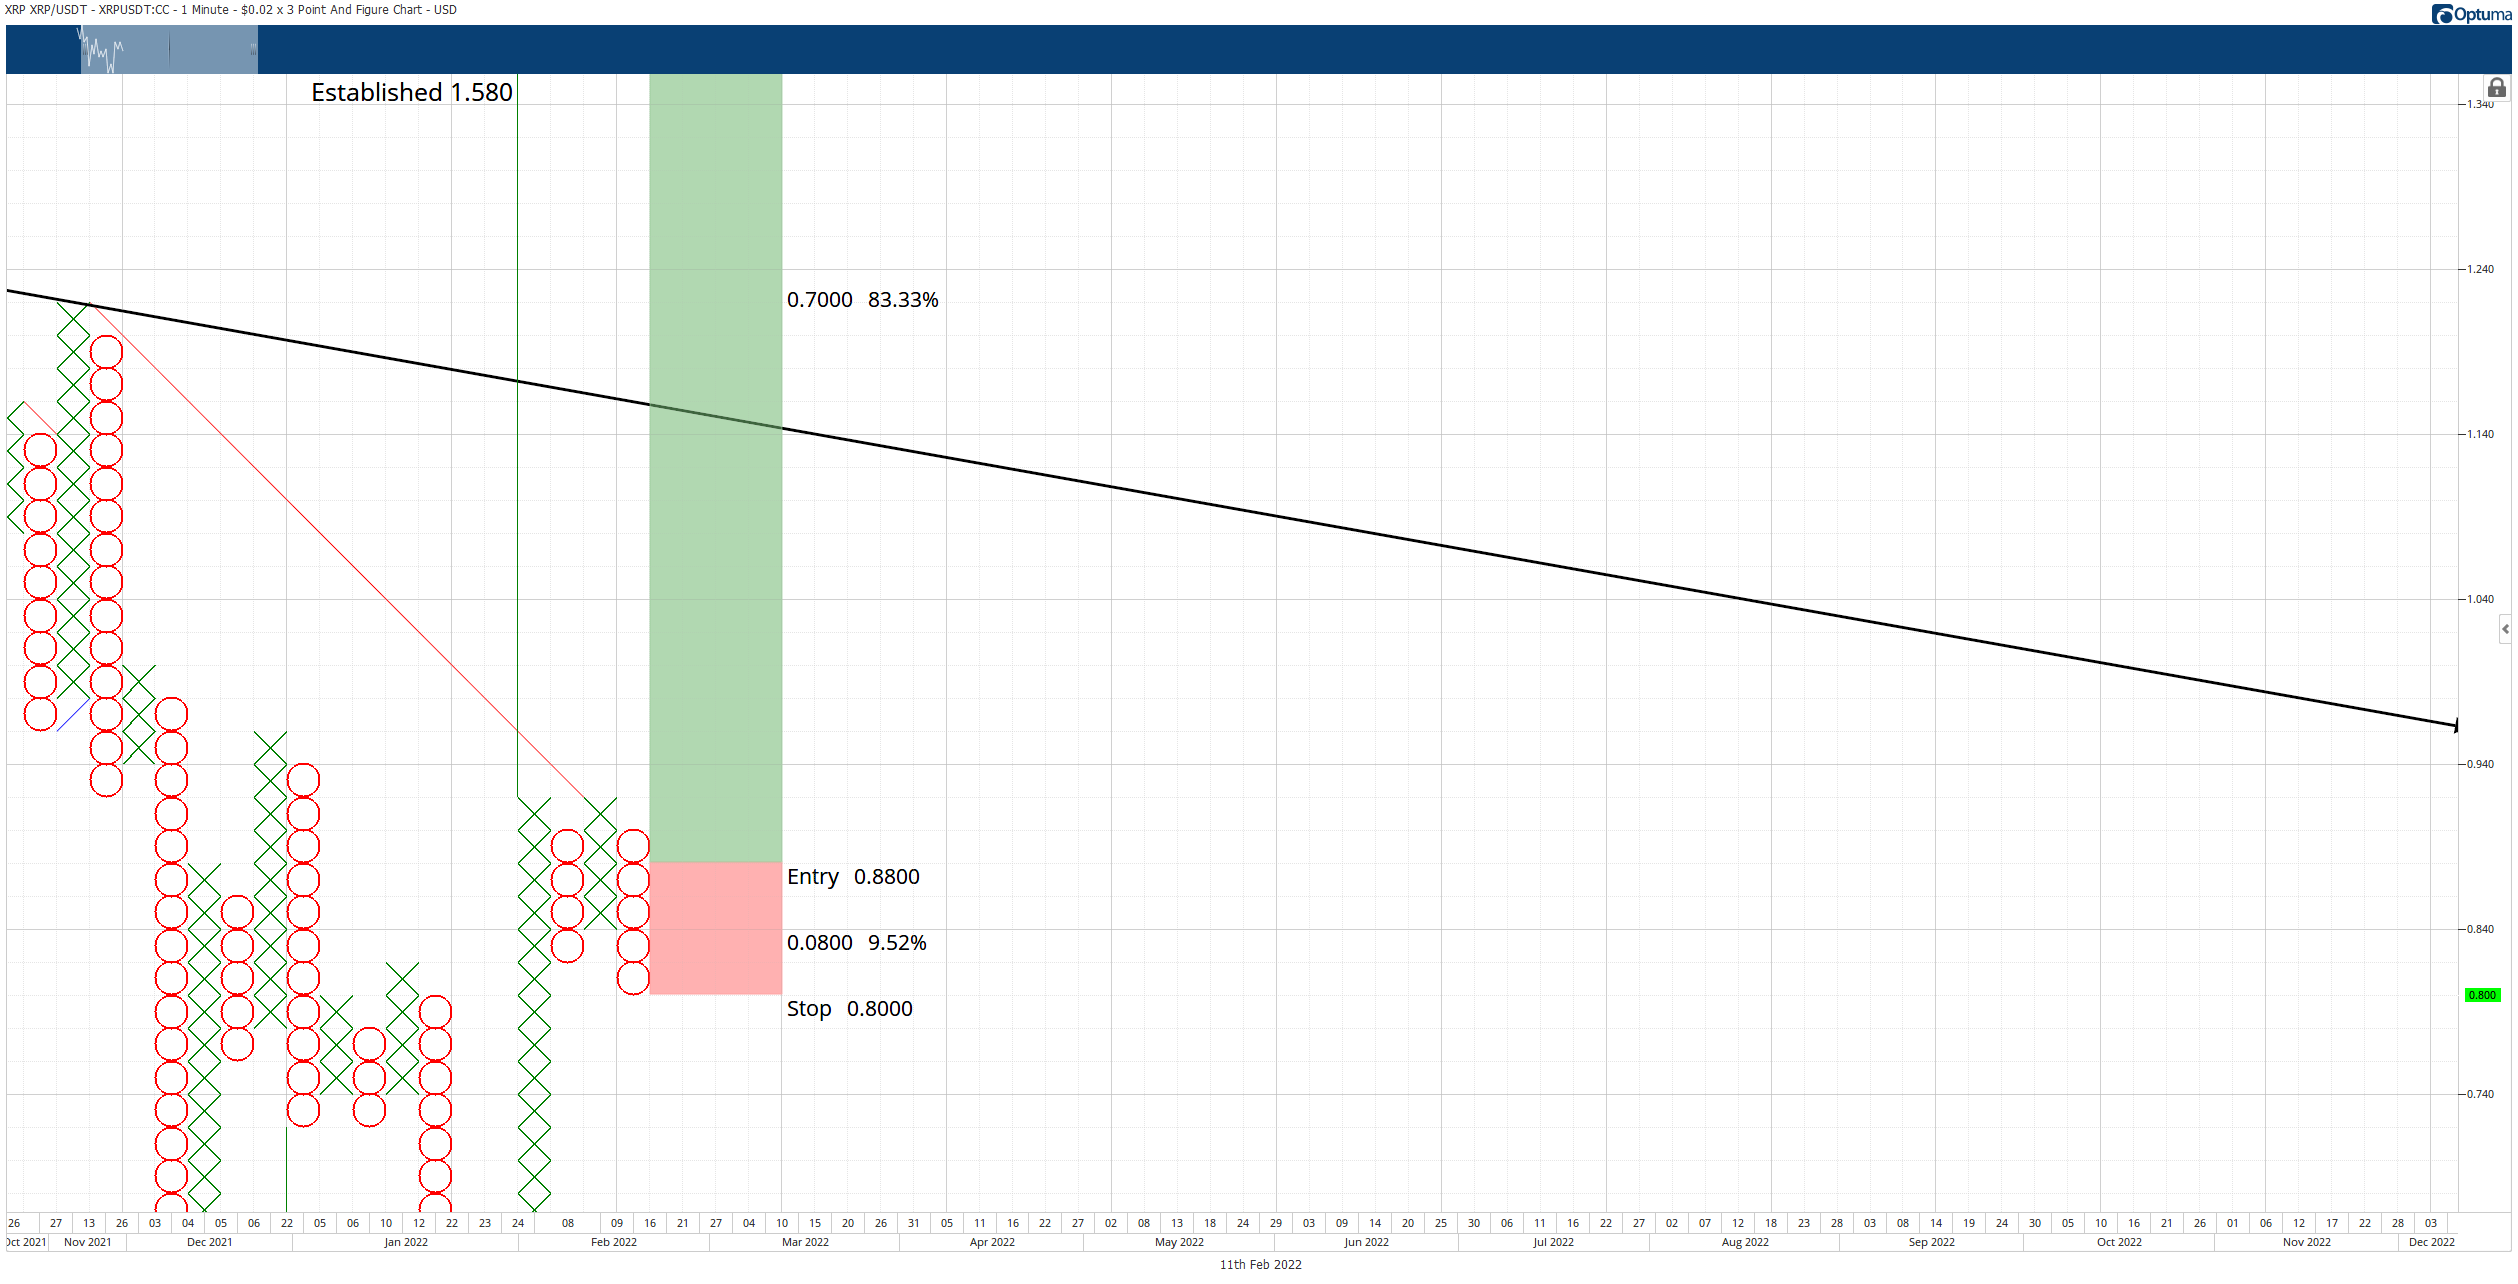
XRP/USD $0/02/3-box Reversal Point and Figure Chart
Invalidation of this long opportunity would only occur if the current O-column returned to bear market conditions – which would occur if it moved to $0.62.
Author

Jonathan Morgan
Independent Analyst
Jonathan has been working as an Independent future, forex, and cryptocurrency trader and analyst for 8 years. He also has been writing for the past 5 years.


