XLM price unfazed by sellers as it marches towards $0.25
- XLM price maintains its persistent and steady move higher.
- Nearly all minor dips are getting bought.
- Price action structure suggests a setup similar to the January 2021 rally may occur.

XLM price action, while recently bullish, has not had much in the way of positive sentiment or momentum. Believe it or not, XLM is one of the few altcoins and cryptocurrencies not to have made a new all-time high in the past two years. In fact, XLM has not made a new all-time high since January 3, 2018. However, that may change.
XLM price shakes of attempts to push Stellar lower, buying pressure remains steady
XLM price action recently triggered a theoretical long setup identified on March 18, 2022. The setup was a buy stop order at $0.20, a stop loss at $0.18, and a profit target at $0.30. One of the positive results from the entry triggering was converting the $0.005/3-box reversal Point and Figure chart to a bull market from a bear market.
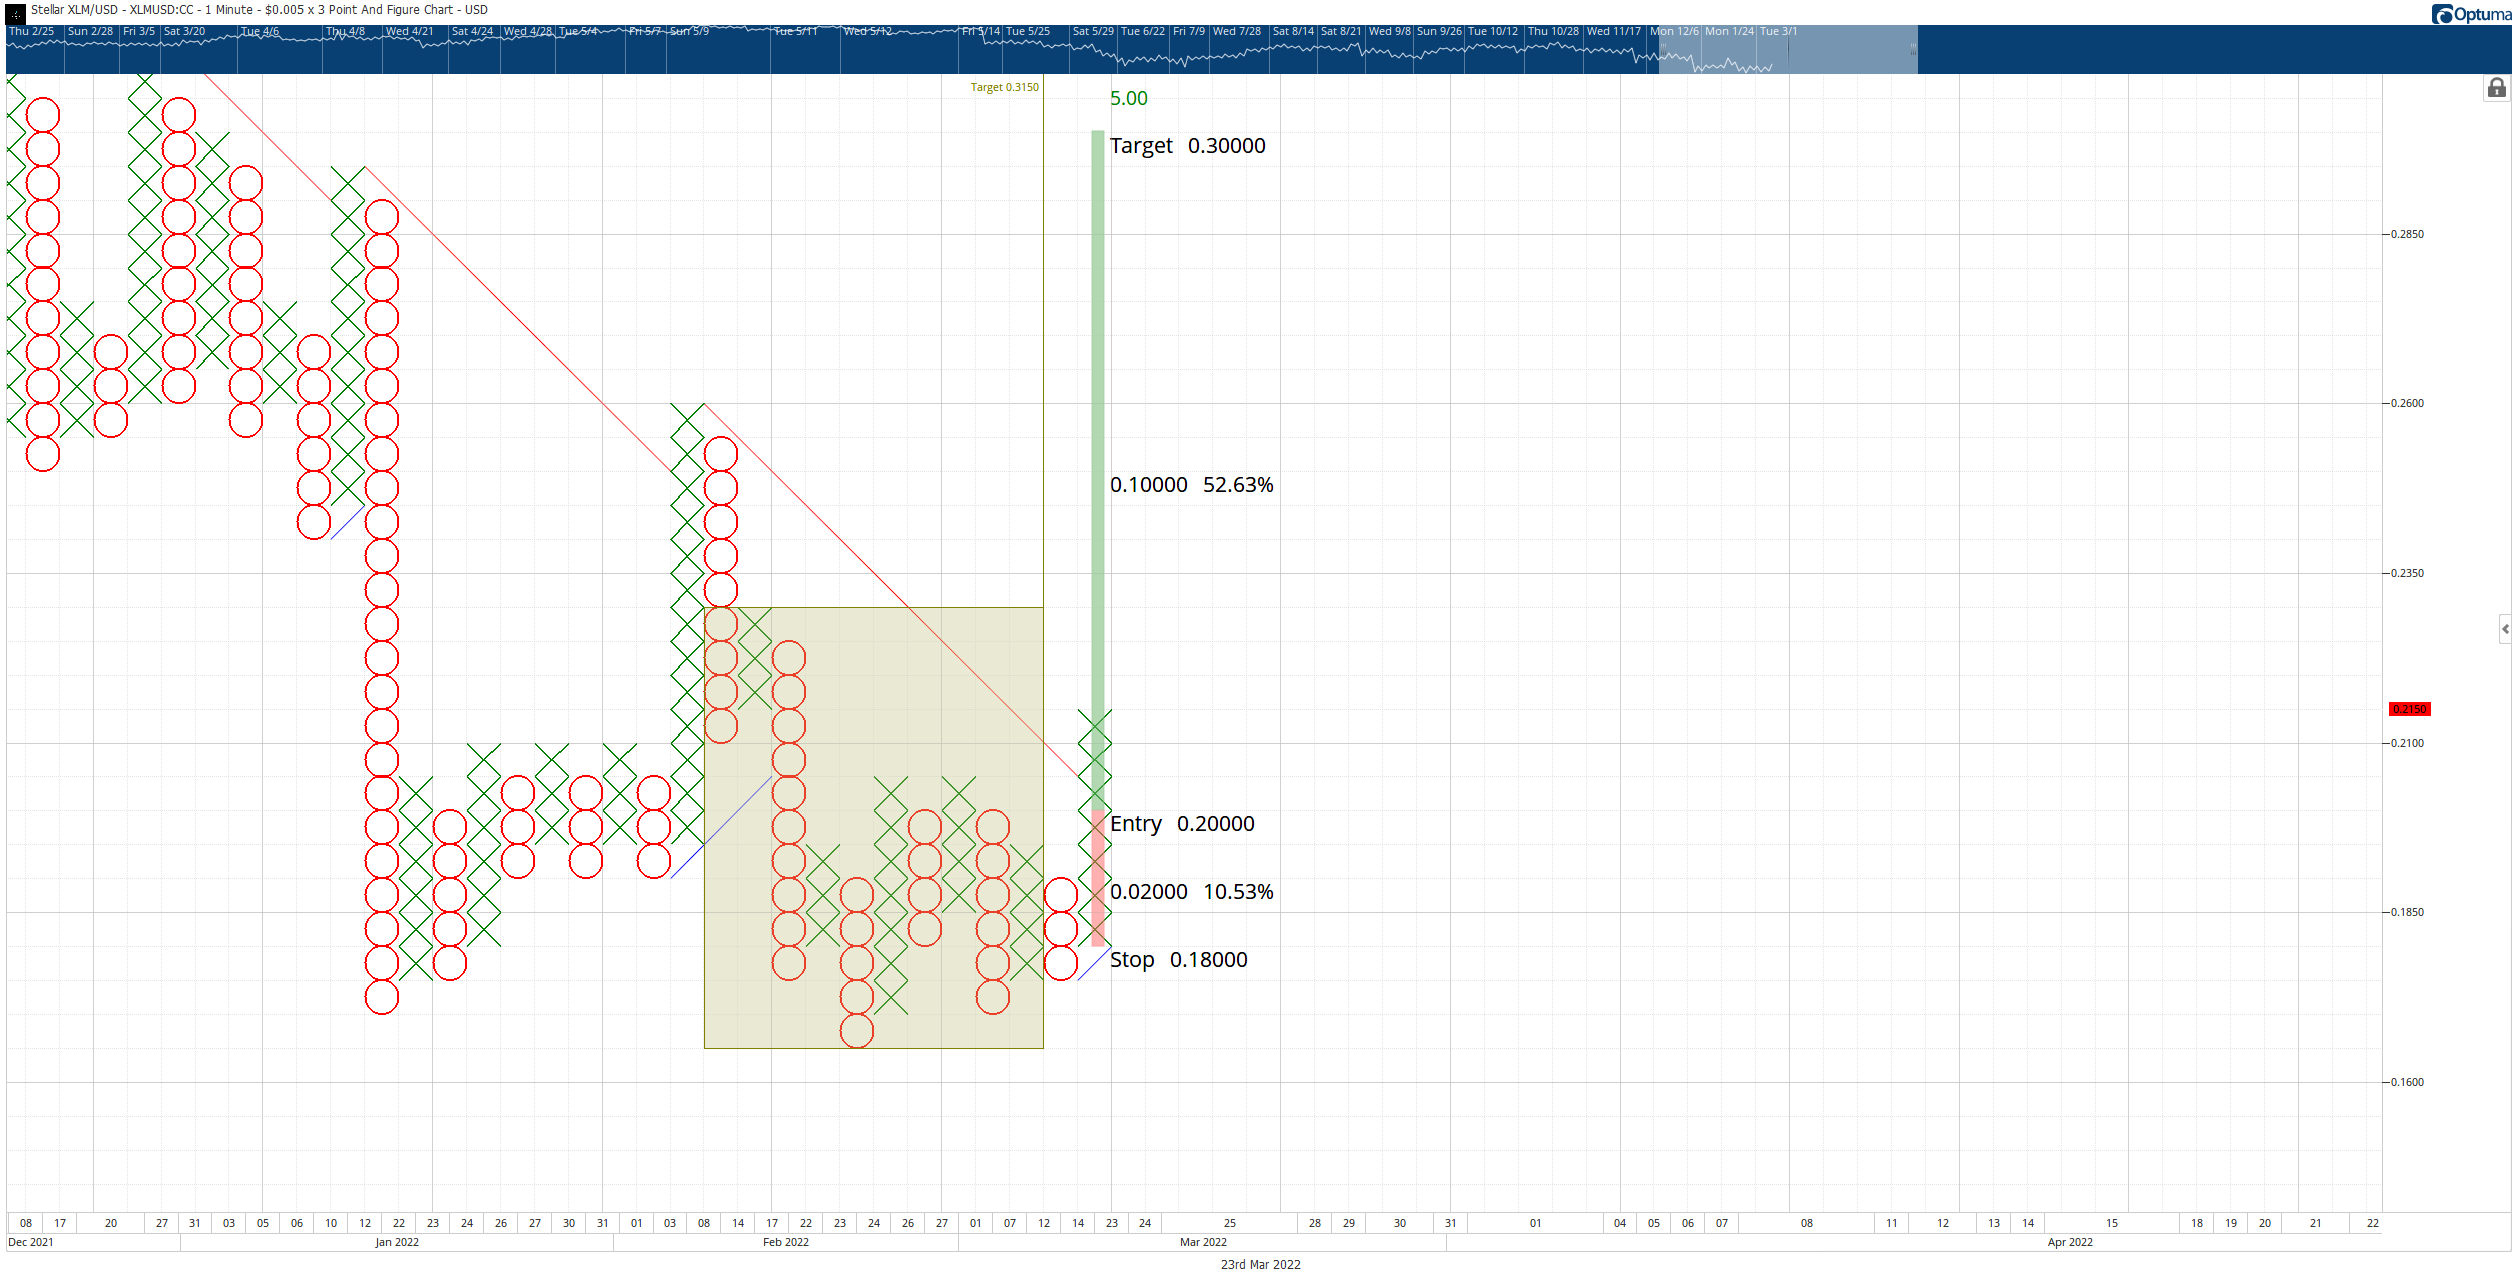
XLM/USD $0.005/3-box Reversal Point and Figure Chart
Pullbacks generally occur soon after a market converts from bear to bull (and vice versa), but XLM may avoid an immediate pullback. That is because of how extended and underperforming XLM price has been over the past months. A primary reason XLM may not experience a quick pullback is that Stellar closed inside the Ichimoku Cloud for the first time in nearly four months.
Additionally, XLM’s oscillators on the weekly chart support further upside momentum. For example, the Relative Strenght Index remains in bear market conditions but has been stuck within the 40 range for all of 2022. Likewise, the Composite Index is moving out of neutral conditions and has crossed above both of its averages, giving more weight to the probability of further upside momentum.
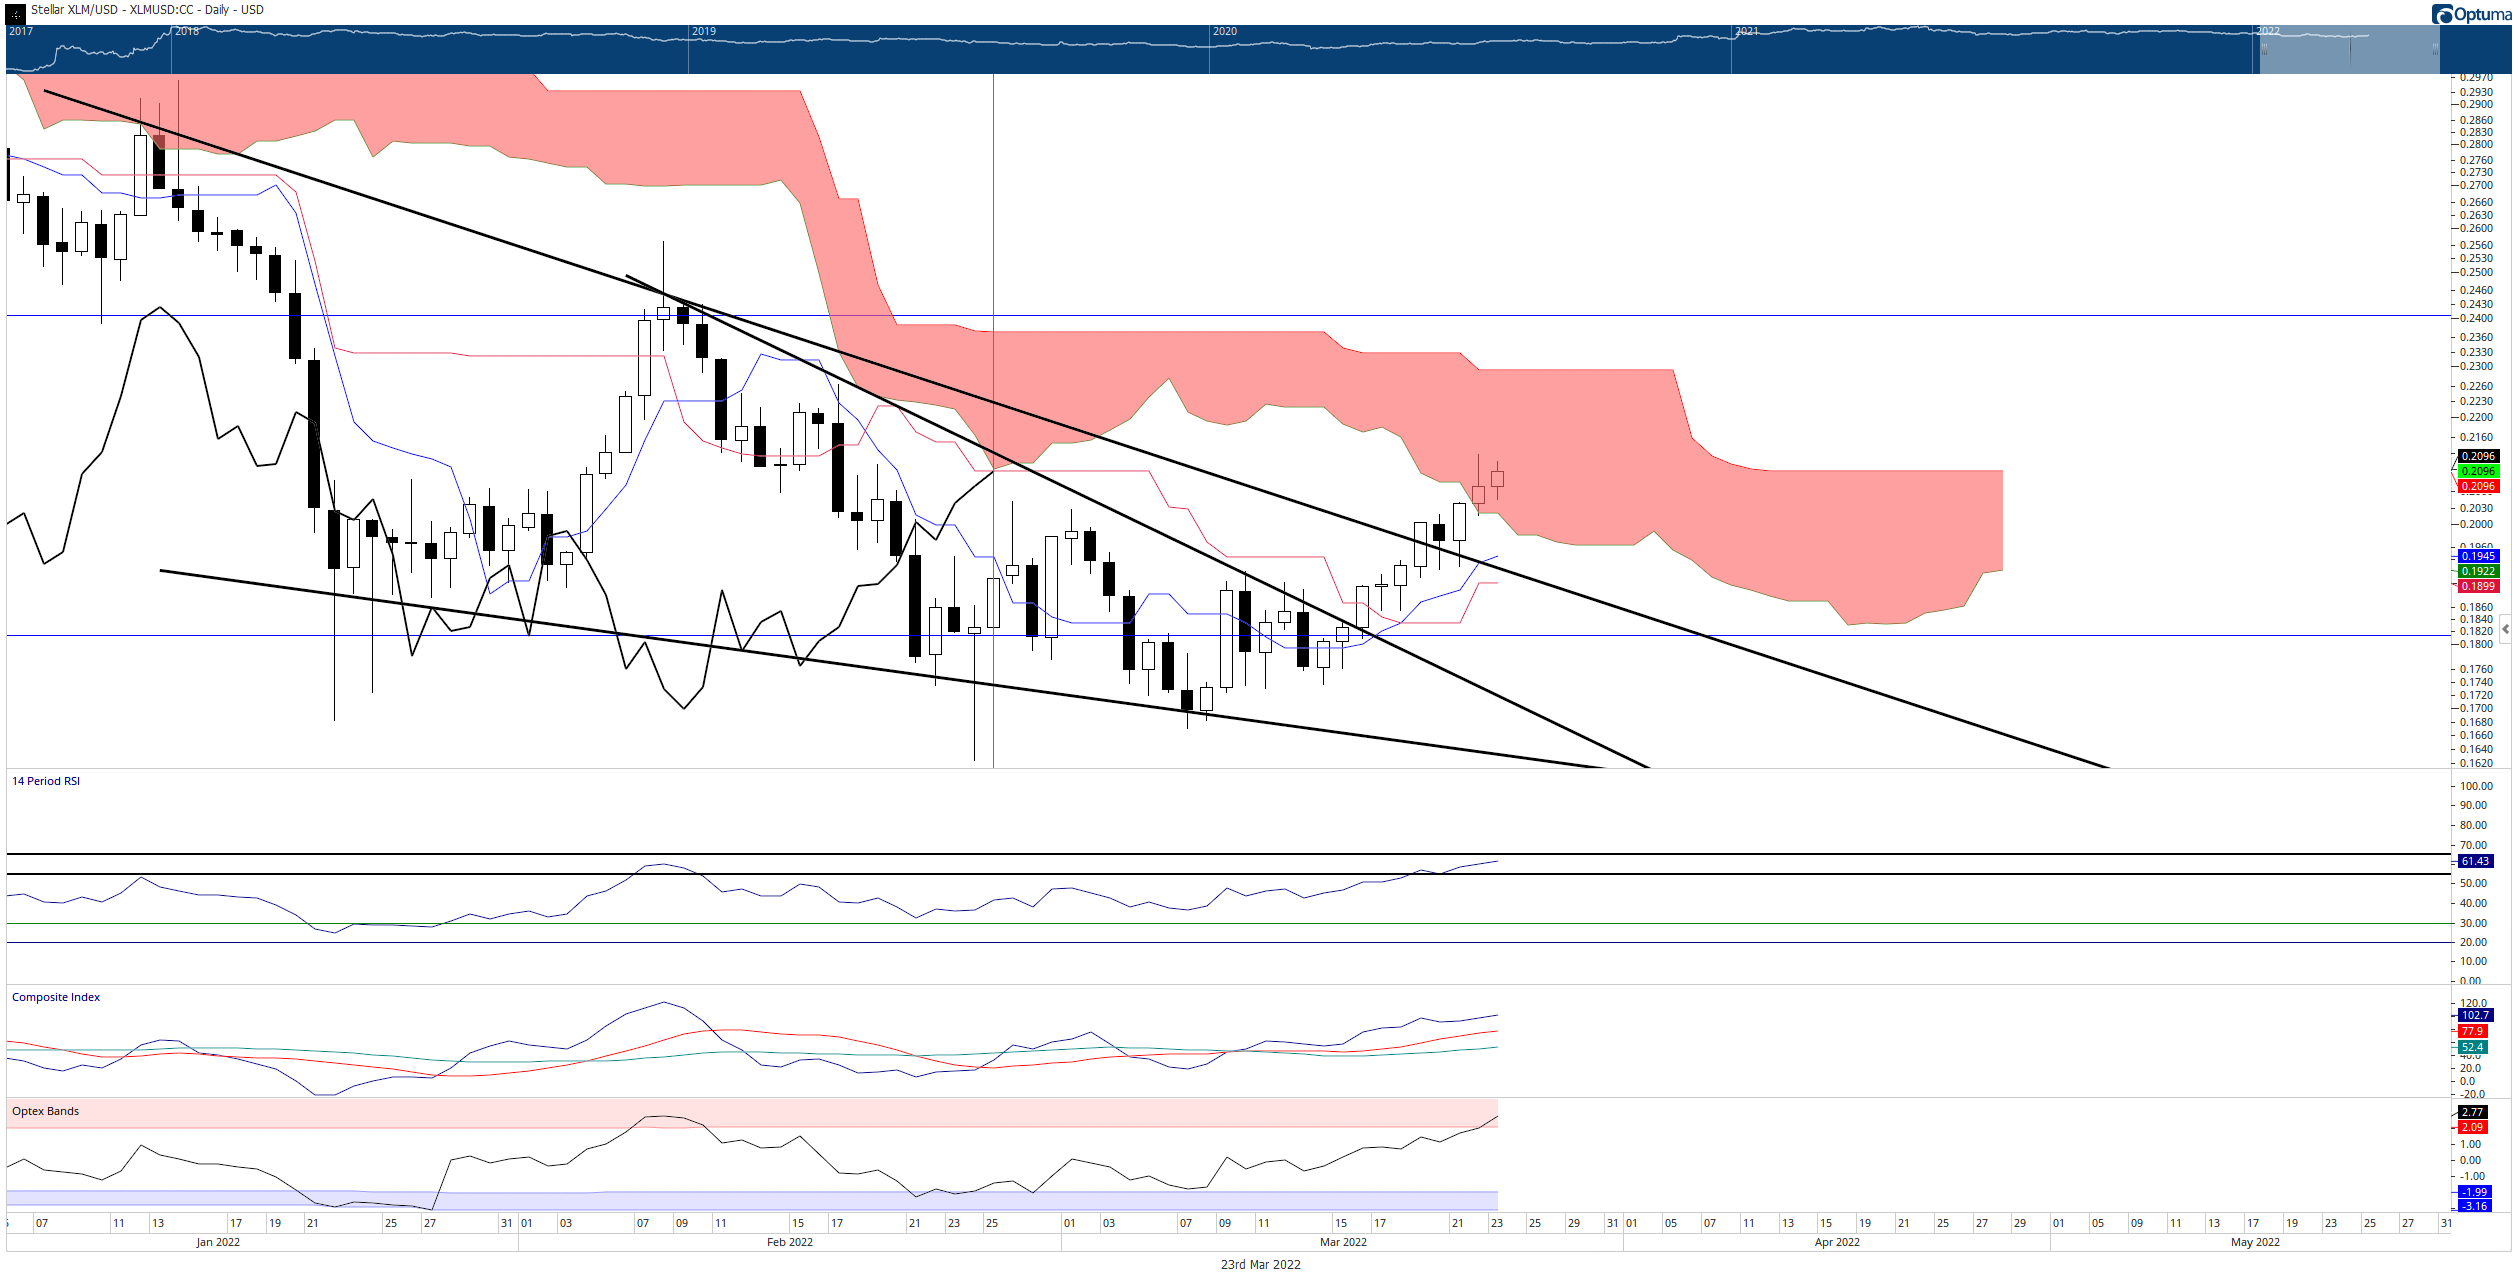
XLM/USD Weekly Ichimoku Kinko Hyo Chart
XLM price will likely find sellers and pressure at the psychologically important $0.25 level, which is shared with the powerful 50% Fibonacci retracement. Therefore, a temporary pause at $0.25 should be expected.
Downside risks do remain a concern but are becoming less of a worry. Bulls really only need to be concerned if XLM price returns below the Ichimoku Cloud and creates a valid Ideal Bearish Ichimoku Breakout - which will only occur if XLM closes at or below $0.17.
Author

Jonathan Morgan
Independent Analyst
Jonathan has been working as an Independent future, forex, and cryptocurrency trader and analyst for 8 years. He also has been writing for the past 5 years.