XLM price and what’s next for Stellar bulls after a 25% rally
- XLM price has breached through a declining trend line, indicating the start of a new uptrend.
- A 26% move toward the next crucial hurdle at $0.254 seems likely for Stellar.
- A daily candlestick close below $0.167 will create a lower low and invalidate the bullish thesis.

XLM price has overcome a resistance barrier vital to its uptrend and potential gains. The run-up needs to maintain the momentum to experience more gains in the near future.
XLM price favors bulls
XLM price set up roughy seven distinctive lower highs since November 2021 and shed roughly 63% of its market value. A trend line drawn connecting the swing points reveals the control of bears.
After forming a base around the $0.167 support level, XLM price embarked on a 25% uptrend that put an end to the long-drawn downtrend by producing a daily candlestick close above $0.200.
This move sets the pace for bulls to take control of Stellar and push it higher. Investors need to keep an eye on the $0.254 resistance barrier, which is roughly a 26% run-up away from the current position since that is the next significant hurdle.
While a move beyond the $0.254 barrier might not be possible at a single stretch, market participants can expect the XLM price to rally at least 26% aforementioned. In a highly bullish case, this uptrend could extend to $0.296, where buyers are likely to book profits.
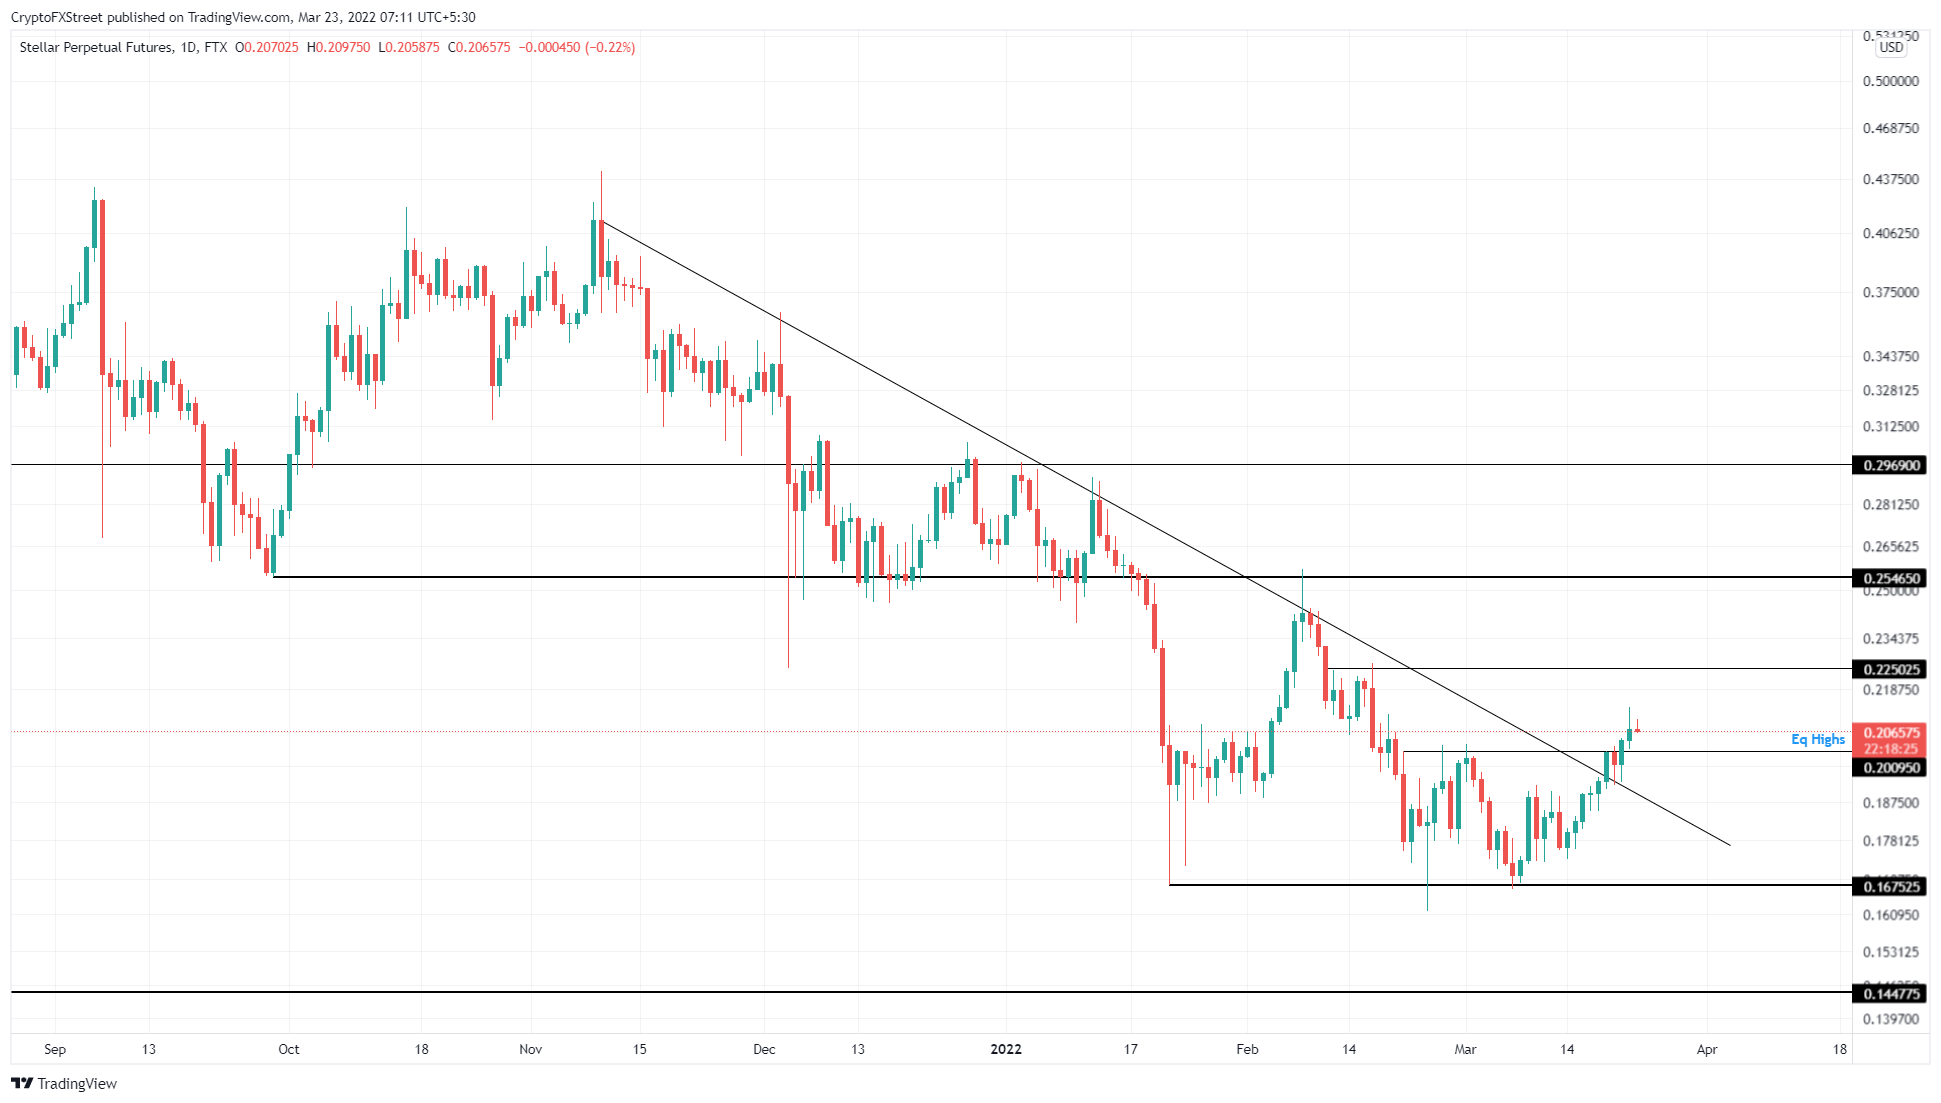
XLM/USDT 1-day chart
On the other hand, a failure from bulls to propel XLM price higher could lead to bears’ taking control. Such a development will likely knock Stellar to immediate support levels, at 0.200. However, a daily candlestick close below the $0.167 will create a lower low and invalidate the bullish thesis for XLM price.
In this case, the remittance token will likely continue heading lower till it finds a stable support level at $0.144.
Author

Akash Girimath
FXStreet
Akash Girimath is a Mechanical Engineer interested in the chaos of the financial markets. Trying to make sense of this convoluted yet fascinating space, he switched his engineering job to become a crypto reporter and analyst.


