• XLM price sees bullish knee-jerk after two rejections by the monthly S1 support level.
  • XLM bulls are buying actively as investors start to preposition for 2022.
  • Expect a further bullish squeeze going against global market turmoil.

Stellar (XLM) price is stuck in a sideways pattern, with price slowly but surely fading below the S1 support level at $0.27. Bulls, for now, are a bit hamstrung by global market turmoil  caused by Omicron fears. Once they have faded, however, expect bulls to kick-off a new rally that will likely break above $0.29 and $0.30, targeting $0.32 where the 200-day Simple Moving Average (SMA) is situated.

XLM bulls squeeze out bears in the preparation of a rally

XLM price action sees a bullish knee-jerk reaction this morning after bears dictated the price action over the weekend with a firm rejection of the monthly S1 support level at $0.27. Bulls were able to break above that same S1 this morning and, in the process, hit some stop losses from bears that were trying to push XLM price action to the downside. In this way, the road got paved for a bullish rally that should face less resistance in the coming trading session at around $0.29.

The only thing that keeps price action a bit muted, for now, however, is the market turmoil this morning as investors weigh in on the hard lockdowns in Europe and the Omicron variant spreading. Once that starts to fade in the coming days, expect bulls to unleash a further rally with the first hurdles at historical resistance at $0.29 and $0.30. Once bulls can charge past those points, the 200-day SMA at $0.32 could see an explosion in buying volume as this will be perceived as a strong signal, triggering further aspirations of more upside to come.
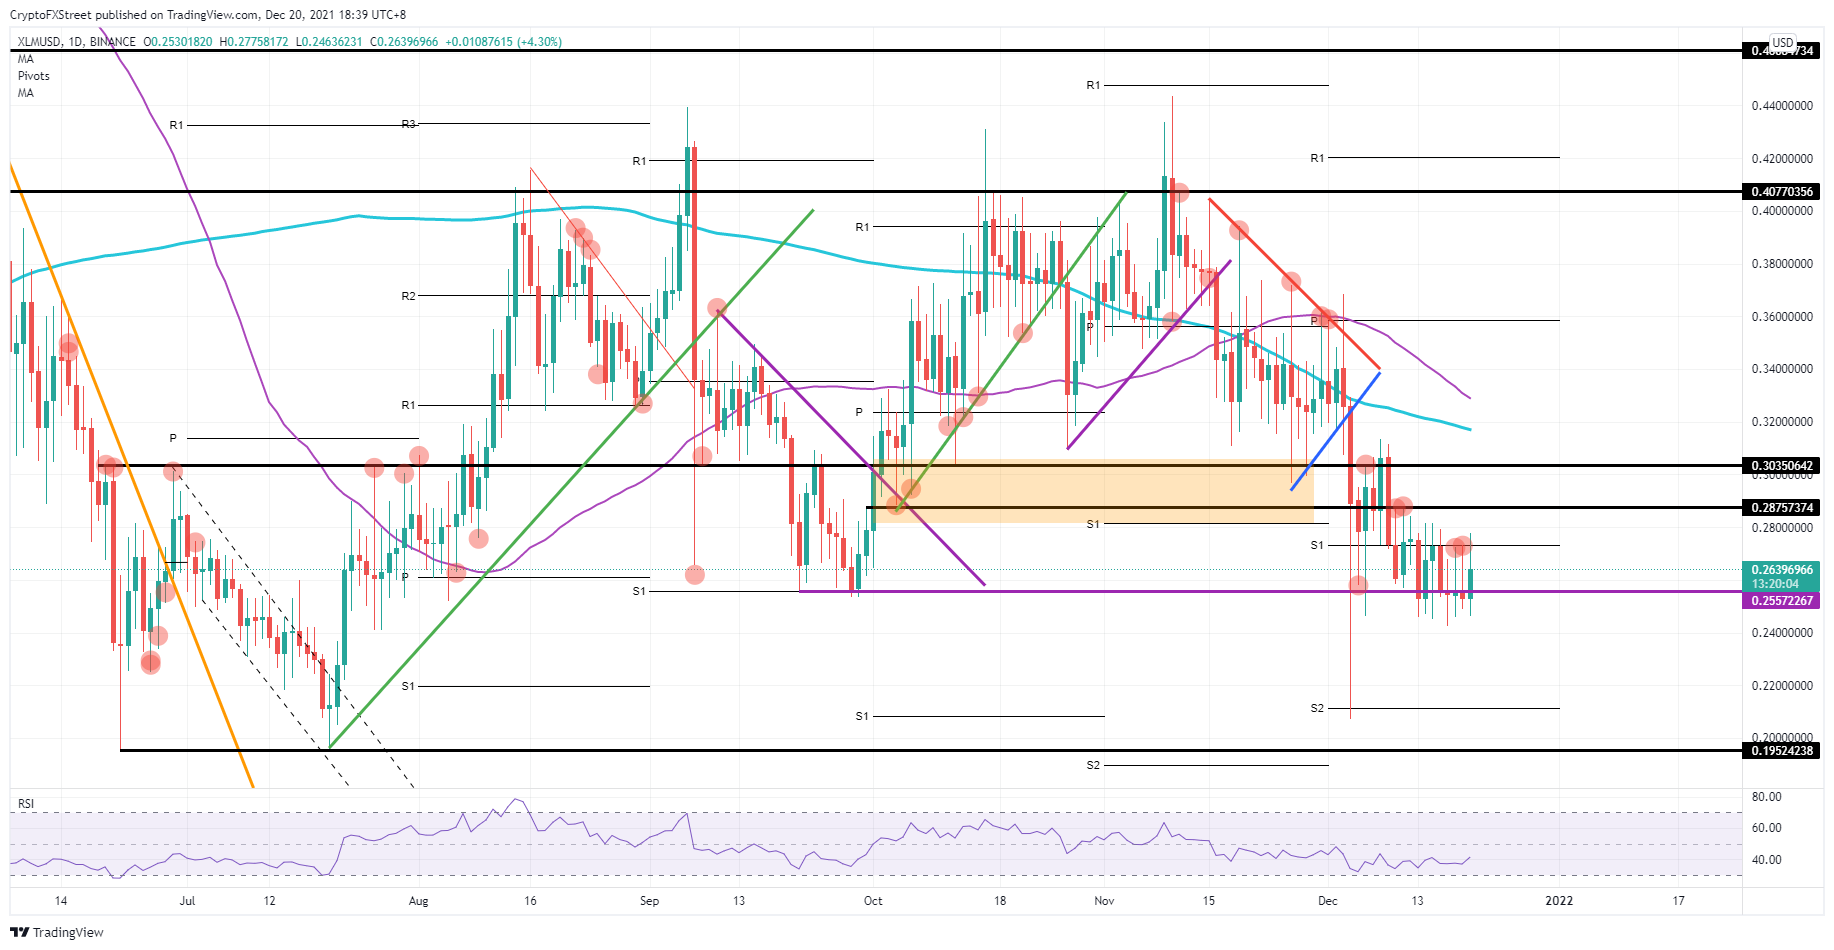
XLM/USD daily chart

XLM/USD daily chart

Current headwinds could weigh even more on sentiment and spark a sell-off amongst investors in cryptocurrencies. This would see a retest around $0.24, targeting the monthly S2 support level at $0.21. That level comes into focus because when coupled with the falling knife price action on December 4 it describes  a double bottom.


Information on these pages contains forward-looking statements that involve risks and uncertainties. Markets and instruments profiled on this page are for informational purposes only and should not in any way come across as a recommendation to buy or sell in these assets. You should do your own thorough research before making any investment decisions. FXStreet does not in any way guarantee that this information is free from mistakes, errors, or material misstatements. It also does not guarantee that this information is of a timely nature. Investing in Open Markets involves a great deal of risk, including the loss of all or a portion of your investment, as well as emotional distress. All risks, losses and costs associated with investing, including total loss of principal, are your responsibility. The views and opinions expressed in this article are those of the authors and do not necessarily reflect the official policy or position of FXStreet nor its advertisers. The author will not be held responsible for information that is found at the end of links posted on this page.

If not otherwise explicitly mentioned in the body of the article, at the time of writing, the author has no position in any stock mentioned in this article and no business relationship with any company mentioned. The author has not received compensation for writing this article, other than from FXStreet.

FXStreet and the author do not provide personalized recommendations. The author makes no representations as to the accuracy, completeness, or suitability of this information. FXStreet and the author will not be liable for any errors, omissions or any losses, injuries or damages arising from this information and its display or use. Errors and omissions excepted.

The author and FXStreet are not registered investment advisors and nothing in this article is intended to be investment advice.

Join Telegram

Recommended content


Recommended Content

Editors’ Picks

LINK price jumps 10% as Chainlink races toward tokenization of funds

LINK price jumps 10% as Chainlink races toward tokenization of funds

Chainlink (LINK) price has remained range-bound for a while, stuck between the $16.00 roadblock to the upside and $13.08 to the downside. However, in light of recent revelations, the token, which powers the verifiable web of the decentralized computing platform, may have further upside potential.

More Chainlink News

Gaming token Notcoin down by almost 50% after airdrop launch

Gaming token Notcoin down by almost 50% after airdrop launch

NOT experienced a rapid decline hours after its anticipated launch on Thursday, shedding almost 50% of its value. This continues the cycle of huge selling pressure faced by cryptocurrency airdrops after their launch, especially the launch of gaming tokens in recent times.

More Notcoin News

Ethereum drops below $3,000 again, spot ETH ETF sparks debate in crypto community

Ethereum drops below $3,000 again, spot ETH ETF sparks debate in crypto community

Ethereum again went below the $3,000 key level on Thursday after posting signs of a rally. The price action follows predictions from the community regarding the SEC's decision on spot ETH ETFs next week.

More Ethereum News

SUI price defends $0.8880 amid multiple Sui network integrations

SUI price defends $0.8880 amid multiple Sui network integrations

Sui (SUI) price failed to heed to the broader market recovery on Wednesday, extending the fall to the $0.8880 support level. However, with multiple network integrations in the works, the altcoin has pivoted around this level and is scaling a recovery.

More Sui News

Bitcoin: Why BTC is close to a bottom

Bitcoin: Why BTC is close to a bottom

Bitcoin (BTC) price efforts of a recovery this week have been countered by selling pressure during the onset of the American session. However, the downside potential appears to have been capped. 

Read full analysis

BTC

ETH

XRP