XLM Price Prediction: Stellar may briefly rebound before resuming 30% decline
- XLM price continues to decline, but within the bounds of a descending channel.
- Stellar six-hour Relative Strength Index (RSI) showing a bullish momentum divergence, hinting at a bounce
- June 26 low of $0.228 is credible support, reinforcing the channel’s midline.

XLM price triggered a larger symmetrical triangle pattern on July 7 while trading in a descending channel since June 30. For now, the longer-term outlook remains bearish, but there is evidence that Stellar may be on the cusp of a mild rebound on the intra-day charts that could test the channel’s upper trendline or even the 50 six-hour simple moving average (SMA).
XLM price to give bears a chance to catch their breath
On July 7, XLM price convincingly broke out from a symmetrical triangle pattern, marking the second symmetrical triangle to trigger since June 11. Stellar did notch an oversold reading on the six-hour RSI following the breakout, but the price rebound was muted and stalled at the upper trend line of the descending channel, returning the focus to the downside.
Today, XLM price is striking support at the June 26 low of $0.228, which coincides closely with the channel’s midline at $0.229. The constructive response to the June 26 low and the channel’s midline combined with the unfolding bullish momentum divergence on the six-hour RSI proposes an intra-day bounce in the coming hours.
If an XLM price rebound gains traction, it will discover resistance at the channel’s upper trend line at $0.246 and the 50 six-hour SMA at $0.252. It would be a minor pause in the Stellar decline, but it offers an entry point for new short positions by agile day-traders.
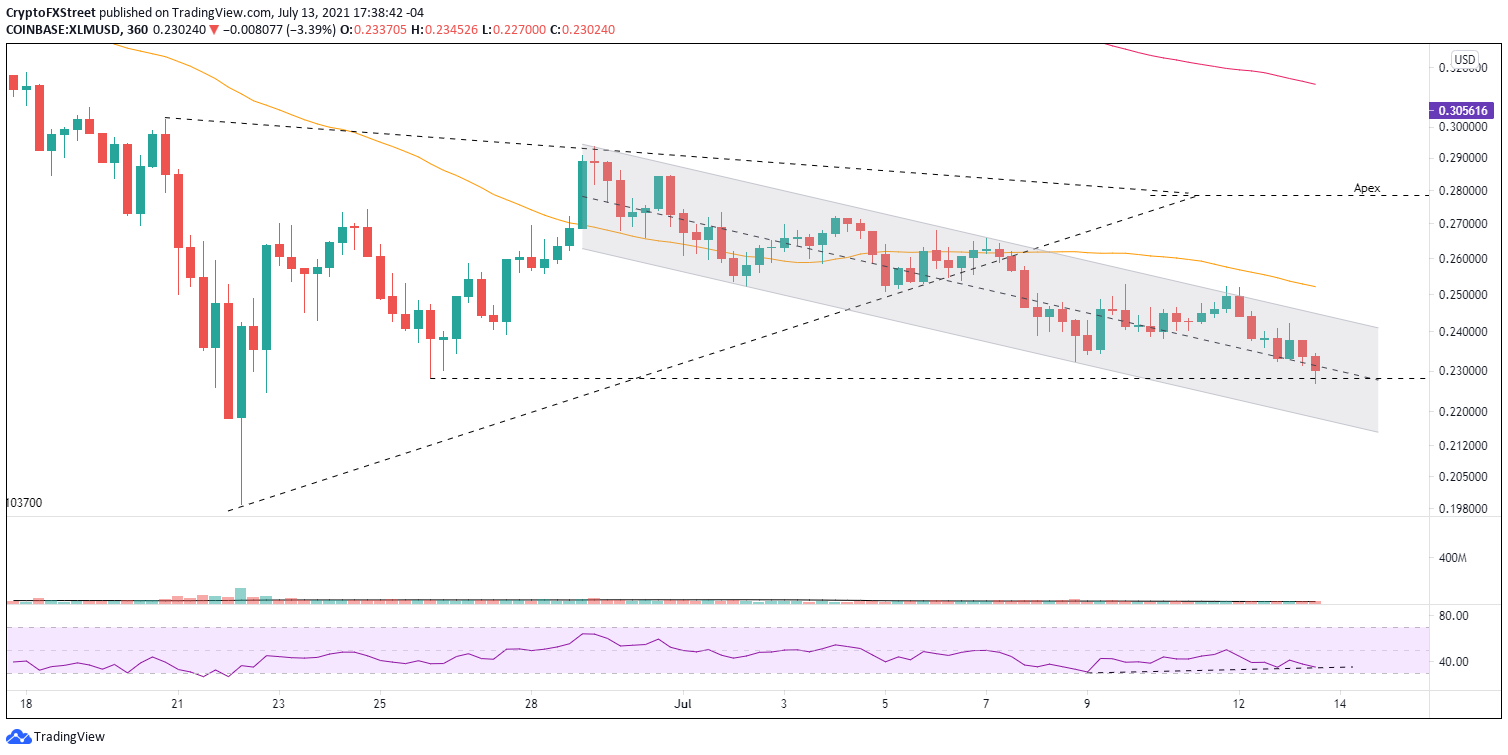
XLM/USD 6-hour chart
As stated, the long-term XLM price outlook remains negative, with the symmetrical triangle pattern projecting a decline of 34% from the breakout and a final low of $0.171. It would wipe out most of the 2021 gains for Stellar and bust the support attached to the June 22 low of $0.198 and the 78.6% Fibonacci retracement level of the March 2020-May 2021 advance at $0.191.
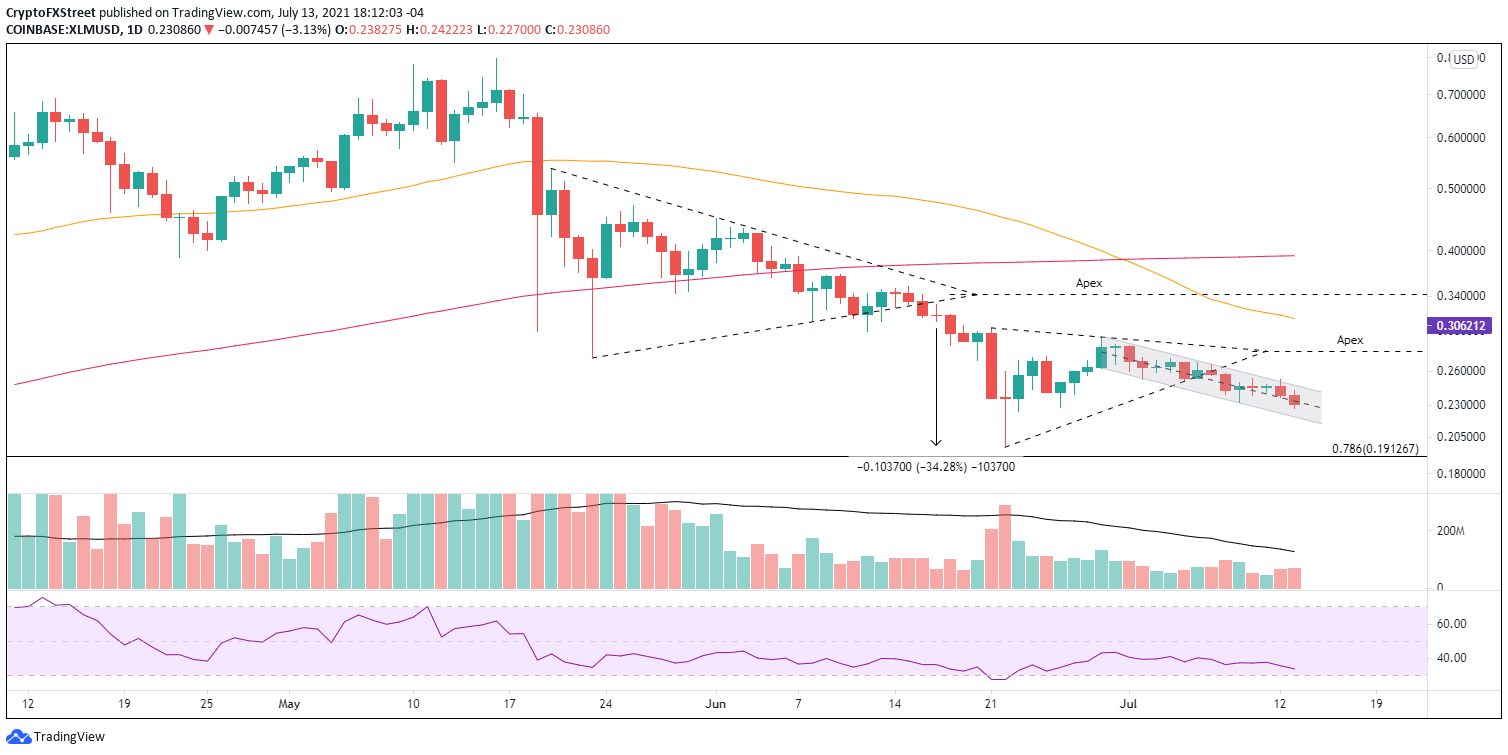
XLM/USD daily chart
A daily close above $0.252 would be the initial signal that the decline is over, and XLM price is readying to test the symmetrical triangle’s apex at $0.278, generating a 20% gain from the current price.
The 50-day SMA at $0.313 will challenge any Stellar strength beyond the apex.
Overall, the six-hour chart does reveal an opportunity for a bounce, but the larger price structure continues to target lower prices moving forward.
Here, FXStreet's analysts evaluate where Stellar could be heading next as it seems bound for higher highs.
Author

Sheldon McIntyre, CMT
Independent Analyst
Sheldon has 24 years of investment experience holding various positions in companies based in the United States and Chile. His core competencies include BRIC and G-10 equity markets, swing and position trading and technical analysis.


