XLM Price Prediction: Stellar history reveals an additional 30% decline
- XLM price locked below formidable resistance, hindering opportunity to rebound.
- A series of 50% declines are a painful precedent for over-eager bulls.
- Fibonacci levels dominate the charts.

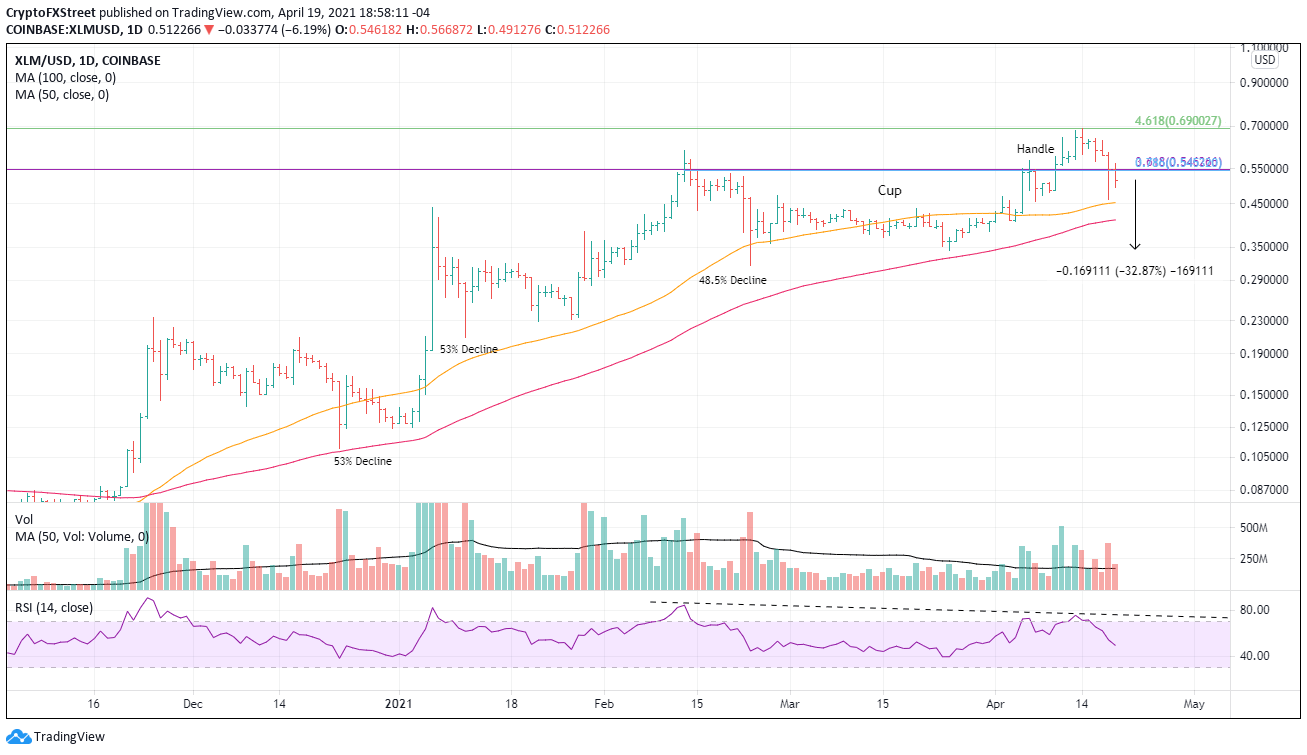
XLM price is now trading below significant resistance at the crossroads of the 361.8% Fibonacci extension of the 2019-2020 bear at $0.5462 and the 78.6% retracement of the February correction at $0.5453. Moreover, it trades below the handle of the previous cup-with-handle base and the previous all-time high at $0.6083, putting bullish speculators in a difficult position moving forward.
XLM price charts are not confusing, but dead cat bounces can be
The outlook for Stellar appeared bullish on the April 10 breakout from a cup-with-handle base. Still, the new high was not confirmed by the daily or weekly Relative Strength Index (RSI) and soon stalled at the 461.8% extension of the 2019-2020 bear market at $0.6900 before it began falling on April 14, before the weekend meltdown.
With price now below critical resistance framed by the two Fibonacci levels mentioned in the first paragraph and key levels of the former base, speculators need to consider the historical precedents of Stellar since the September 2020 lows.
The last three corrections have averaged around 50%, and two of three have been quick in duration, lasting four and nine days, respectively. If the precedent continues, Stellar is poised to quickly decline 33% from the current price level, melting through the 100-day simple moving average (SMA) at $0.4097 and potentially testing the March low at $0.3420.
If XLM price discards the February low, it would break with the series of higher lows for the corrections and put Stellar on course for a painful few months.
XLM/USD daily chart
If Stellar commands some commitment and emotion from the bullish speculators and reclaims $0.5453 on a weekly basis, the outlook should flip neutral and put the February high at $0.6083 in the crosshairs. Of course, any further upside potential will be challenged at $0.6900.
Bullish sentiment is confronted by deteriorating technicals and a history of significant corrections. For just that reason, it is essential to let Stellar prove itself before engaging on the bullish side.
Author

Sheldon McIntyre, CMT
Independent Analyst
Sheldon has 24 years of investment experience holding various positions in companies based in the United States and Chile. His core competencies include BRIC and G-10 equity markets, swing and position trading and technical analysis.


