XLM Price Forecast: Stellar measured move target limits upside for speculators
- XLM price rally from a cup-with-handle pattern has stalled above 61.8% Fibonacci retracement.
- Grayscale adds 5.56 million of the cryptocurrency over the last 30 days.
- Stellar slightly overbought according to daily Relative Strength Index (RSI).

XLM price has stumbled out of a cup-with-handle base on a 12-hour chart. The lack of impulsiveness combined with a near touch of the measured move target points to a pause for the new rally or even a bull trap. Either way, the short-term upside appears limited.
XLM price being weighed down by overextended funding rates
To calculate a measured move for a cup-with-handle pattern, there are two options. The most common one is to take the percentage gain from the cup low to the lip of the handle and then add it to the handle high. In the case of XLM and based on this methodology, price projects a rally of 87% from the handle, reaching $1.08. A gain of that magnitude would take the cryptocurrency into new all-time highs.
A second methodology is to calculate the difference from the handle high to the low of the cup and then multiply it by the percentage actually reaching their price target, which currently is 61%, according to Bulkowski. Using this approach, the measured move for XLM is far more modest at 28% and just above yesterday’s high.
The convergence of the measured move with the 61.8% retracement of the 2018-2020 bear market at $0.66 will continue to generate short-term resistance for the rally. However, the stumbles post-breakout raise the probability that the upside may be a bear trap.
Instant support is at the 21 twelve-hour simple moving average (SMA) at $0.54 and the cluster of the 50 twelve-hour SMA and 100 twelve-hour SMA at $0.46 and $0.43, respectively.
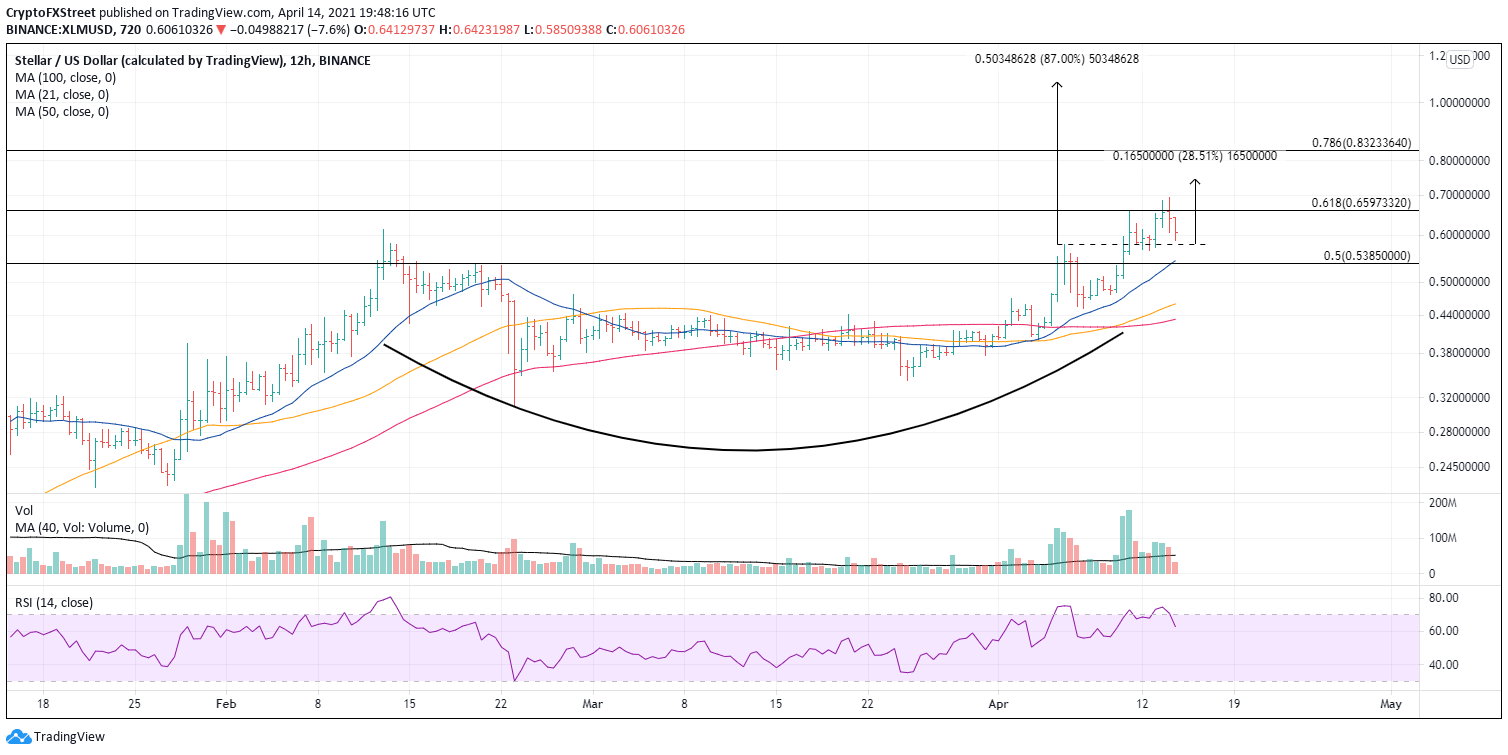
XLM/USD 12-hour chart
On the upside, speculators should anticipate resistance at the modest measured move target of $0.74 and the 78.6% retracement of the 2018-2020 bear market at $0.83. A test of the all-time high at $1.05 is not a consideration at this moment.
Author

Sheldon McIntyre, CMT
Independent Analyst
Sheldon has 24 years of investment experience holding various positions in companies based in the United States and Chile. His core competencies include BRIC and G-10 equity markets, swing and position trading and technical analysis.