XLM price looks dicey as bulls are inching away from a strong Fibonacci level
- XLM price has rallied more than 15% and is coming close to the 1.618 Fib level
- Stellar Lumens price has broken out of a pennant on the 9-hour chart
- A break below $0.20 could be a good exit strategy

XLM price has traders feeling less enthusiastic about placing an entry as it has serious resistance barriers lying ahead.
XLM price is a tricky one
XLM price has recently broken out of a pennant-like formation on the 9-hour chart. Pennants are commonly known to project volatile momentum in the direction they break.
It is also worth noting that the apex of the pennant into its peak can be used to estimate price projections. The pennant on the 9-hour chart suggests Stellar Lumens price could rise 4.66%.
A Fibonacci retracement level from the previous swing low to swing has the 1.618 level, just 5% above the current XLM price of $0.2136. Traders seeing this are likely to be stifled by this scenario. The current price can continue extending; however, the volume profile does not show significant interest from Smart Money either.
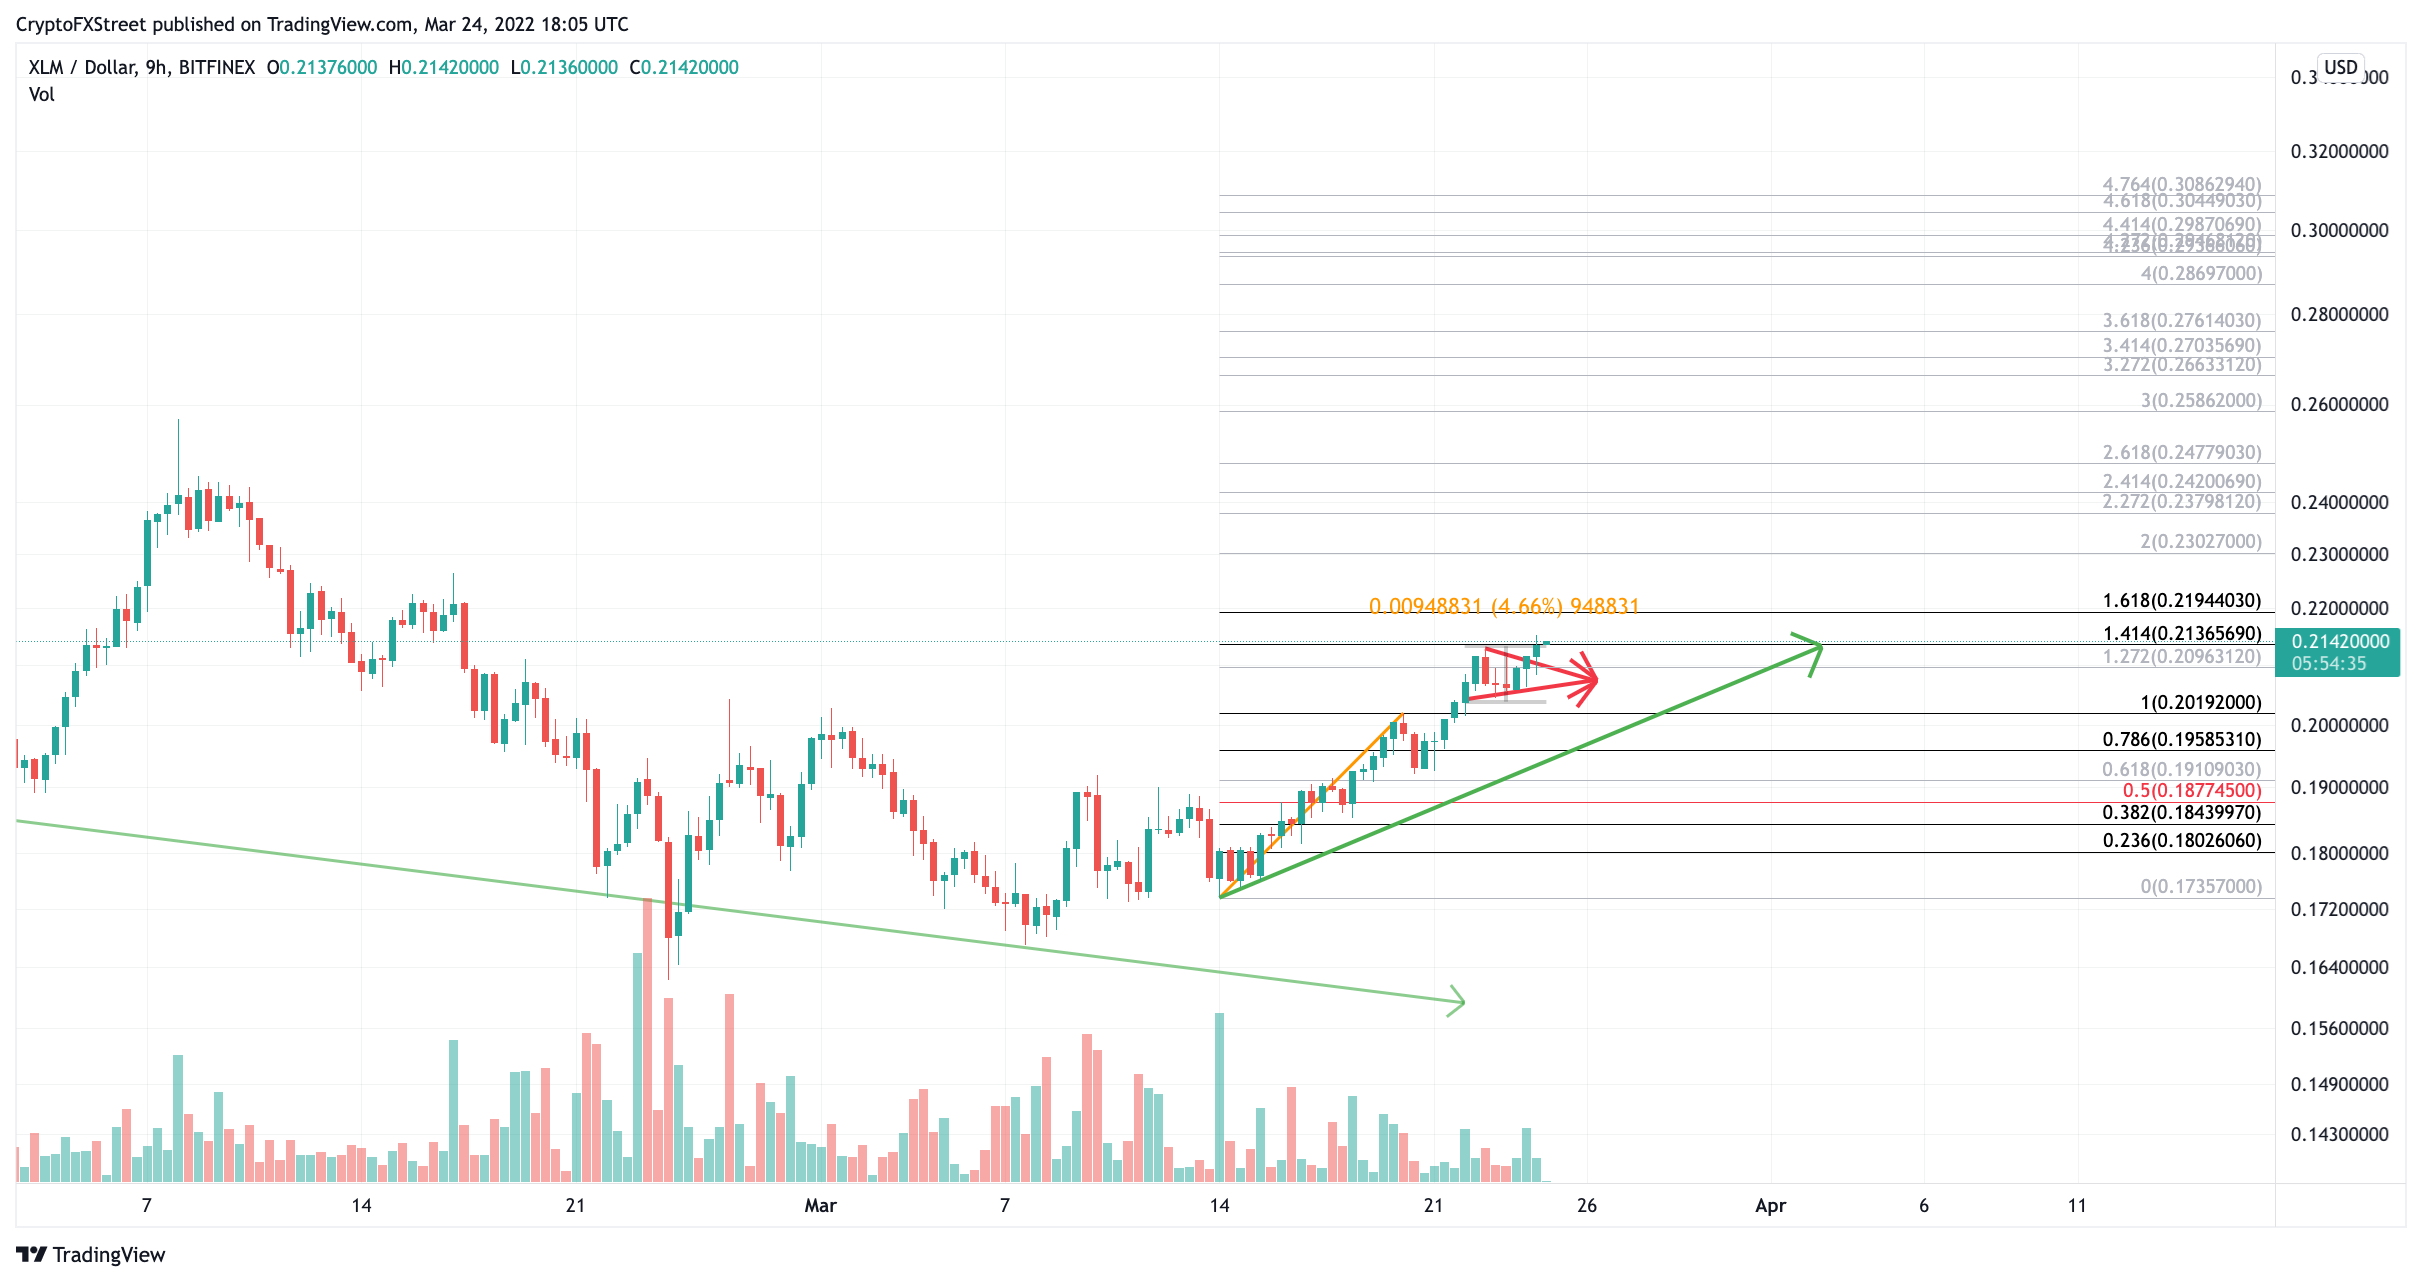
XLM/USD 9-hr Chart
With all of the evidence put forward, it may be best for early traders to consider moving their safety stops under the pennant at $0.20. There is a chance that the current XLM price action is merely a 1, 2,1, 2 wave count with a more significant wave three underway.
For investors looking to hodl, the best confirmation of a change in trend will be a break below the green ascending trend line or a current price of $0.19
If this were to happen, XLM price would likely fall back into the .618 and .5 Fibonacci levels at $0.19 and $0.17, respectively, which would result in a 15% drop from the current price.
Author
FXStreet Team
FXStreet
Composed of a group of economic journalists and FX experts, the FXStreet content team produces and oversees all content published on FXStreet. It provides a purely journalistic approach to the Forex market.


