- Tezos price climbed 13% overnight, XTZ is battling resistance at $1.50.
- The open-source blockchain token is in a short-term uptrend, targeting the $1.75 level.
- Google Cloud partnered with Tezos, joining the XTZ network as a validator and securing its blockchain.
Tezos, the native token for an open-source blockchain that executes peer-to-peer transactions has witnessed a massive spike in its price with Google Cloud’s partnership announcement. Tezos (XTZ) price yielded 13.4% gains since February 22 and continued its short-term uptrend, targeting $1.75.
Also read: What do institutional giants know about GMX: Do Amber Group and Arca expect a 20% rally?
Tezos price rallied in response to Google Cloud’s partnership announcement
Tezos, an open-source blockchain that executes peer-to-peer transactions got a massive boost from its partnership with Google Cloud. The technology giant has joined Tezos as a “baker,” a validator that helps set up nodes for verifying transactions on the XTZ network and securing it using Google Cloud.
Google Cloud has partnered with Aptos and Solana in a similar manner, joining these networks as a block-producing validator.
Tezos price climbed to $1.44, gearing up to tackle key resistance at $1.50, in response to Google’s partnership news.
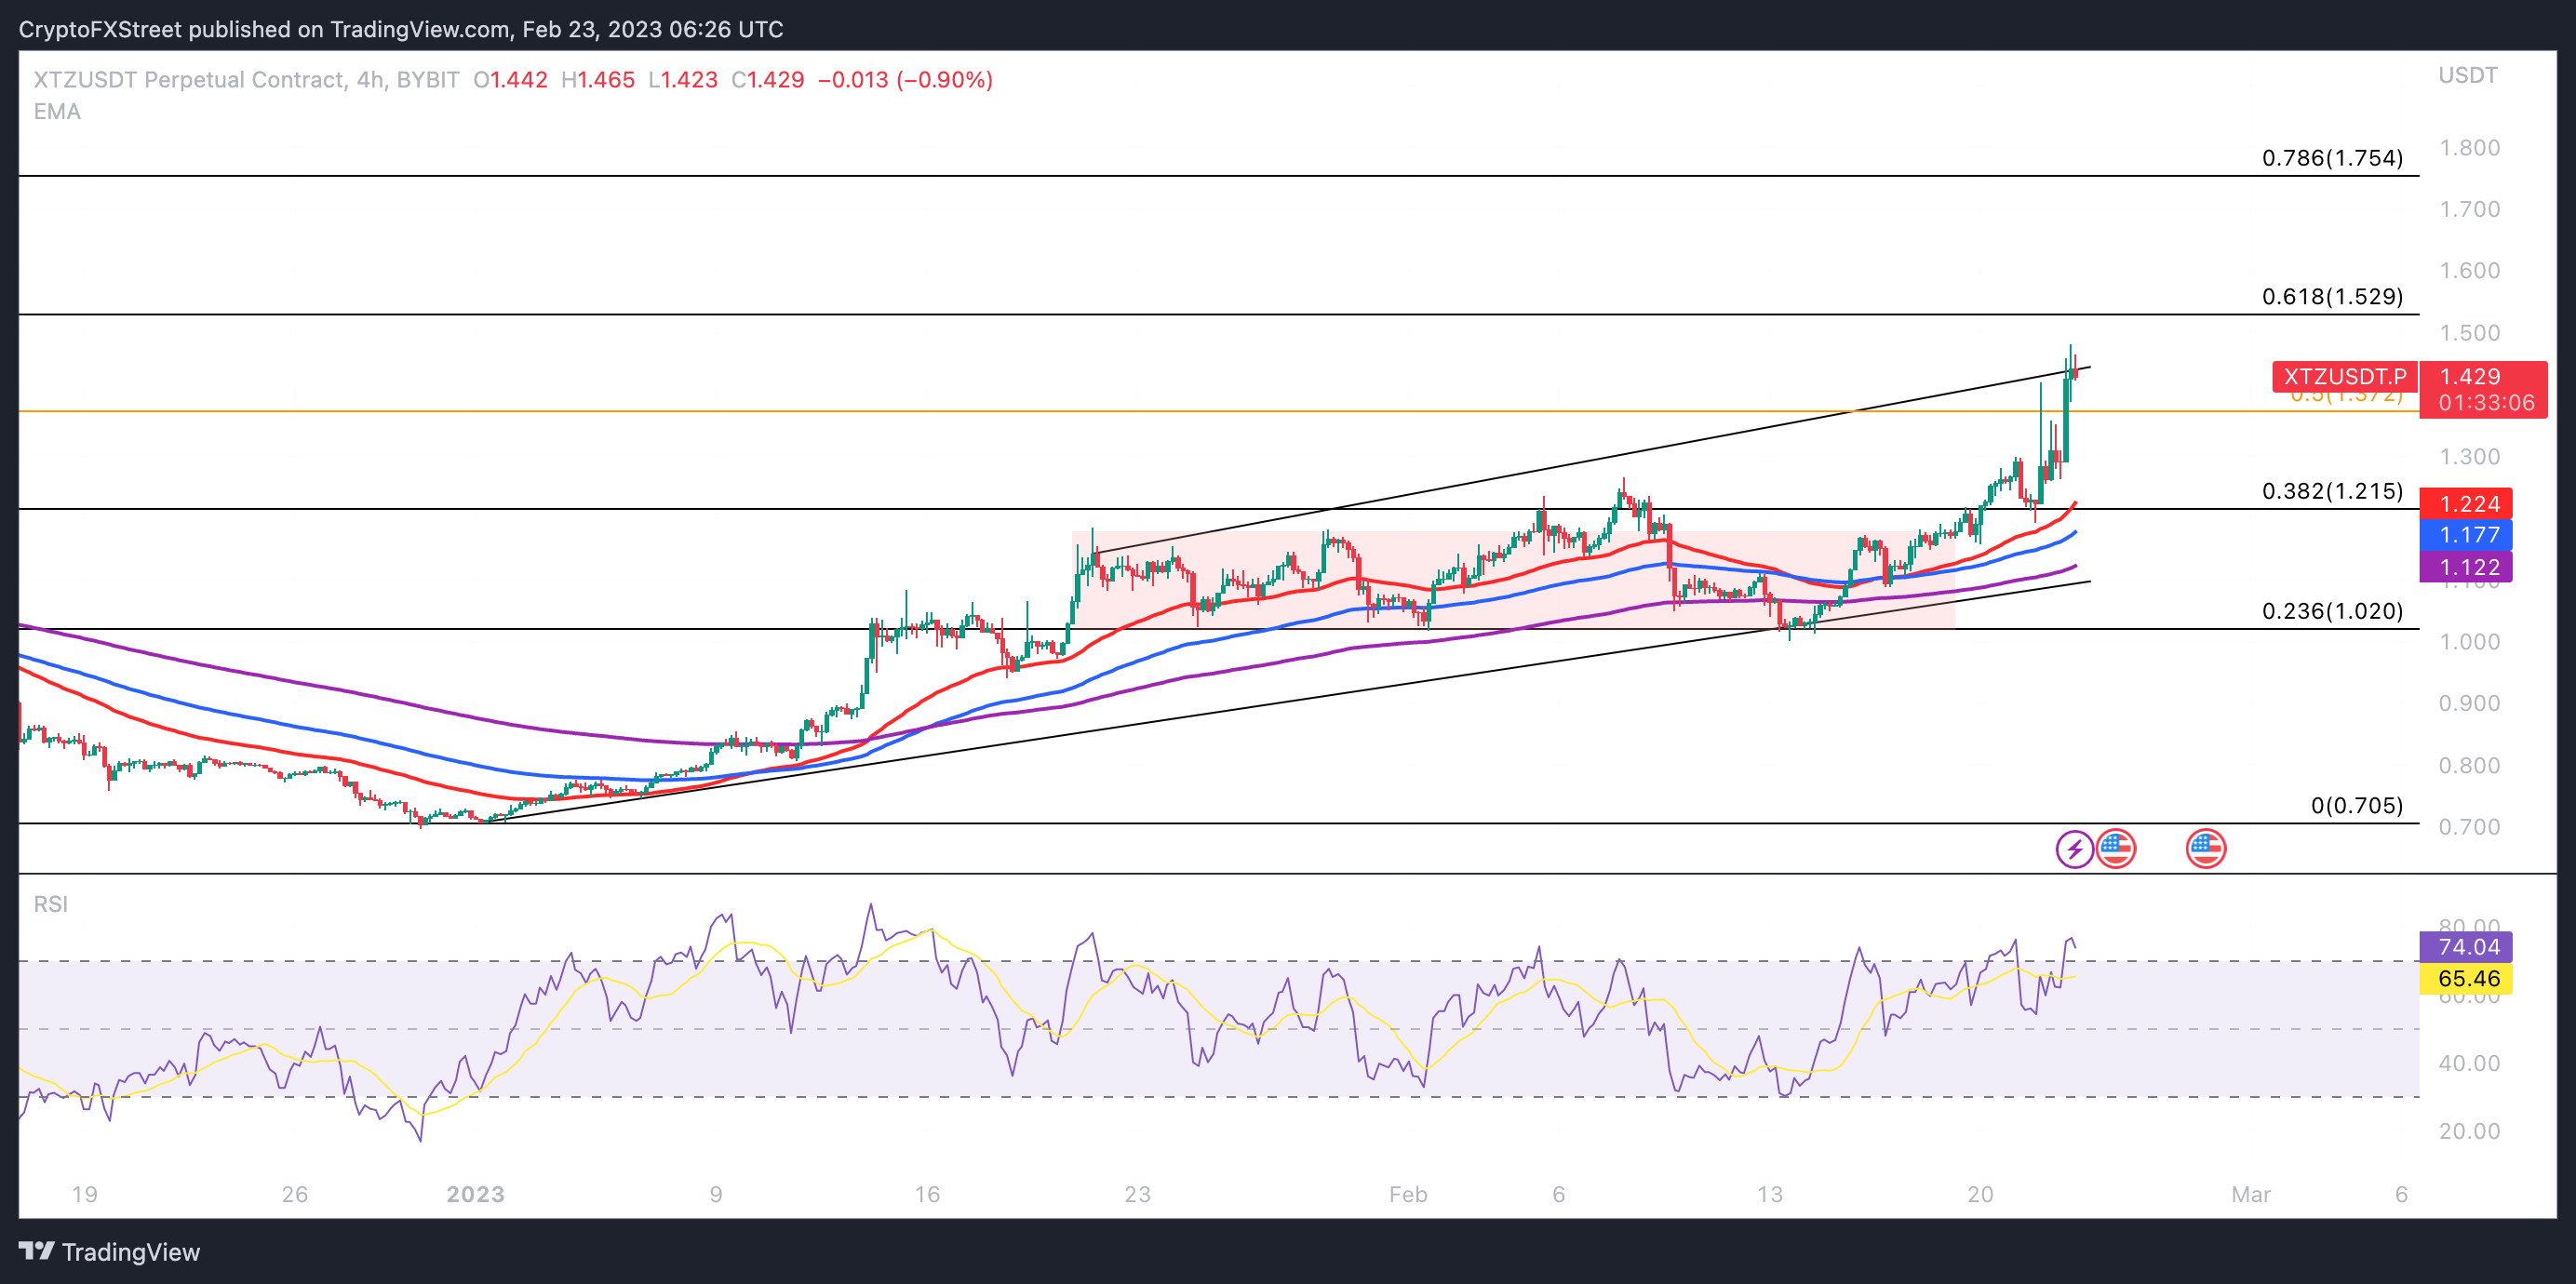
XTZ/USDT Perpetual Contracts 4H chart
As seen in the chart above, XTZ price is currently in a short-term uptrend. On the 12H price chart, Tezos is in a downtrend. There is a significant support zone between $1.017 and $1.177 where XTZ spent nearly 30 days, from mid-January to February. Since the announcement of Google Cloud’s partnership, XTZ resumed its short-term uptrend, climbing to higher highs, close to the 61.8% Fibonacci Retracement at $1.529.
If bulls push XTZ to the 61.8% Fib retracement target, a run up to 78.6% at $1.754 is likely. On the 12H price chart, Relative Strength Indicator (RSI), a momentum indicator reveals a bearish divergence. While XTZ price is forming higher highs, RSI is forming lower highs between January 16 and mid-February 2023.
Bearish divergence in RSI signals a lack of underlying strength in the current uptrend. If XTZ price drops below 50% Fibonacci Retracement at $1.372, it could plummet to the support zone between $1.017 and $1.117, where it spent nearly 30 days.
If XTZ fails to sustain above the $1.300 level, it would invalidate the bullish thesis for the native token of Tezos protocol.
Information on these pages contains forward-looking statements that involve risks and uncertainties. Markets and instruments profiled on this page are for informational purposes only and should not in any way come across as a recommendation to buy or sell in these assets. You should do your own thorough research before making any investment decisions. FXStreet does not in any way guarantee that this information is free from mistakes, errors, or material misstatements. It also does not guarantee that this information is of a timely nature. Investing in Open Markets involves a great deal of risk, including the loss of all or a portion of your investment, as well as emotional distress. All risks, losses and costs associated with investing, including total loss of principal, are your responsibility. The views and opinions expressed in this article are those of the authors and do not necessarily reflect the official policy or position of FXStreet nor its advertisers. The author will not be held responsible for information that is found at the end of links posted on this page.
If not otherwise explicitly mentioned in the body of the article, at the time of writing, the author has no position in any stock mentioned in this article and no business relationship with any company mentioned. The author has not received compensation for writing this article, other than from FXStreet.
FXStreet and the author do not provide personalized recommendations. The author makes no representations as to the accuracy, completeness, or suitability of this information. FXStreet and the author will not be liable for any errors, omissions or any losses, injuries or damages arising from this information and its display or use. Errors and omissions excepted.
The author and FXStreet are not registered investment advisors and nothing in this article is intended to be investment advice.
Recommended Content
Editors’ Picks
Week Ahead: Altcoin plays for traders as Bitcoin crosses $42,000

Bitcoin price hit $40,000 over the weekend as investors anticipate a spot BTC ETF approval in January. Bitcoin trades around $42,000 and shows no signs of stopping. This article will focus on what to expect this week and the outlook for BTC and if the fourth cycle is any different.
Crypto exchanges serving Indian residents to comply with Anti-Money Laundering guidelines: Indian Parliament

Crypto exchanges serving Indian residents to face action if not compliant with Anti-Money Laundering and Countering of Financial Terrorism guidelines.The process of registering offshore exchanges, Virtual Digital Asset service providers has been initiated.
Dogecoin breaks key $0.088 barrier ahead of tenth birthday, 87% DOGE holders at profit

As Dogecoin (DOGE) approaches its tenth anniversary on Wednesday, the Shiba-Inu-themed meme cryptocurrency has surpassed a crucial resistance level at $0.088076, reaching the highest level since mid-April.
Bitcoin price could rally to $45,000 ahead of BTC halving event in April 2024

Bitcoin price crossed the $41,000 mark on Binance, in its ongoing uptrend. BTC price rally is likely driven by the anticipation of Spot Bitcoin ETF approval. There are more catalysts driving BTC price gains in the current cycle.
Analyzing potential $30k corrections ahead of BTC ETF approval

Bitcoin has slowed down its 2023 bull rally as it approaches the $37,000 level. After three weeks of consolidating around this level, BTC shows no directional bias whatsoever. Some investors speculate this could be an upward-sloping accumulation that leads to a $40,000 rally.