Why XRP price will disregard the FUD and double soon
- XRP price is repeating a fractal – a recurring price pattern – that was seen in mid-2021, hinting at a violent bullish reversal.
- If this setup comes to fruition, the remittance token could rally 110% and form a local top at $1.35.
- A daily candlestick close below $0.528 will invalidate the bullish thesis for Ripple.
XRP price action over the last six months has created a bottom reversal pattern that holds massive promise. While Ripple has kicked off a leg higher, investors need to keep a close eye on the altcoin to capitalize on the evolving uptrend.
XRP price is launch-ready
XRP price formed a swing high at $1.349 on August 15, 2021, after rallying 161% in roughly a month. A few days later, Ripple tried to overcome this hurdle, and whilst it succeeded temporarily it failed to consolidate its gains and fell after posting a higher high at $1.416. This was followed by another failed retest of $1.349 on November 11.
This swing high is the starting point of a W-bottom pattern, which usually contains a long downswing followed by two retests of a support level after sufficient distance. The second retest of the floor is likely to be followed by an impulsive move to the starting point. This price action resembles the letter “W,” hence the namesake “W-bottom” pattern. This pattern indicates the potential for a reversal higher once the top of the W has been broken and retested.
XRP price recently tagged the $0.582 support floor on May 1, indicating that the next leg-up is going to be a massive move. In total, this run-up would constitute a 130% gain, but from the current position, it would amount to a 110% ascent.
While the uptrend and the target might seem straightforward, the journey is not. XRP price will face multiple hurdles along the way. The first blockade in its path is the $0.70 barrier; clearing that will open the path for Ripple bulls to propel the token to a resistance range, extending from $0.917 to $0.998.
This area is by far the most gruesome level for bulls; hence clearing it will pave the way for a relatively resistance-free path up to the target at $1.349 for XRP price. In total, this move would constitute a 110% ascent from the current position at $0.642.
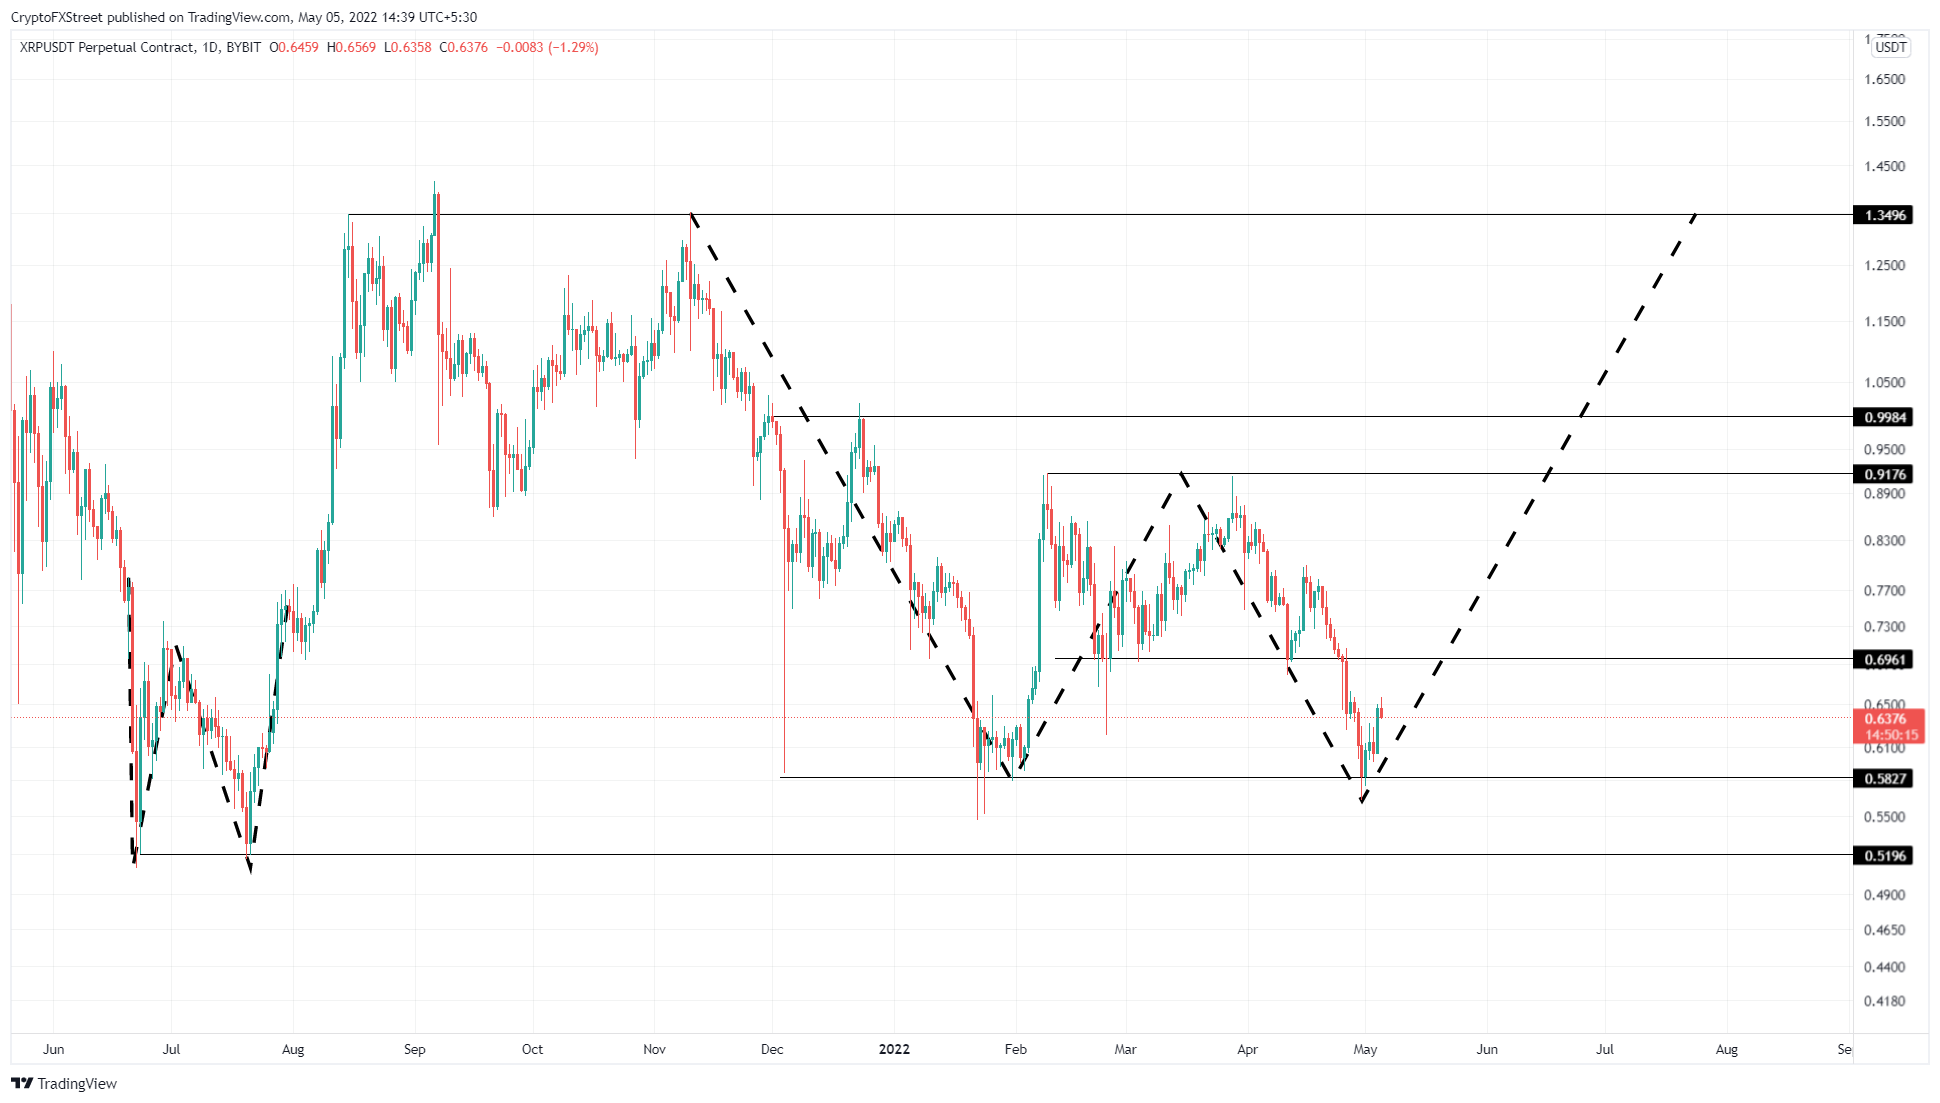
XRP/USDT 1-day chart
Adding a tailwind to Ripple’s bullish outlook is the 365-day Market Value to Realized Value (MVRV). This on-chain metric is used to determine the average profit/loss of investors that purchased XRP tokens over the past year and can be helpful in timing local bottoms and tops.
Based on Santiment’s backtests, a value below -10% to -15% indicates that short-term holders are underwater and are less likely to sell at a loss. Interestingly, the long-term holders capitalize on this opportunity to accumulate, which is why this area is termed an “opportunity zone.”
At the time of writing, the 365-day MVRV for XRP price is at -25%, well inside the opportunity zone. Historically, this area is a local bottom which triggered XRP price to rally 60% in January 2022. Therefore, the current position also suggests that long-term investors are likely to accumulate and trigger a run-up.
 [12.49.02, 05 May, 2022]-637873386107187868.png)
XRP 365-day MVRV
On the other hand, if XRP price produces a daily candlestick close below $0.528 it will create a lower low below the pattern floor and invalidate the bullish thesis for Ripple. Such a development will open the path for the bears to trigger a 10% crash to $0.519.
Author

Akash Girimath
FXStreet
Akash Girimath is a Mechanical Engineer interested in the chaos of the financial markets. Trying to make sense of this convoluted yet fascinating space, he switched his engineering job to become a crypto reporter and analyst.


