Why Crypto.com price may suddenly flip bullish from consolidation
- Crypto.com price is moving sideways within a range ahead of an imminent upside move.
- CRO sits on robust support highlighted by the IOMAP model between $0.1416 and $0.1460.
- Crypto.com price will keep moving sideways if whales don’t discontinue their selling activities.

Crypto.com price has temporarily halted its quest to recover lost ground to $0.5000 and later to $0.9140 (all-time high). The path with the least resistance flipped north after CRO embraced primary support at $0.1062 in June and July. Two key levels at $0.1562 (upper range limit) and $0.1408 (lower range limit) will determine where CRO heads next.
Is Crypto.com price ready for the next climb?
Crypto.com price firmly holds the 100-day Simple Moving Average (SMA) support amid the push to dodge the bullet fired by bears at the upper range limit. With a confirmed break above this resistance, CRO will relaunch its bullish mission first to $0.2000 and later to $0.5000.
Traders cannot rule out the possibility of losses stretching beyond the 100-day SMA, which brings the lower range limit at $0.1408 into play. Meanwhile, the Moving Average Convergence Divergence (MACD) reveals that Crypto.com price might stay within the range longer than expected.
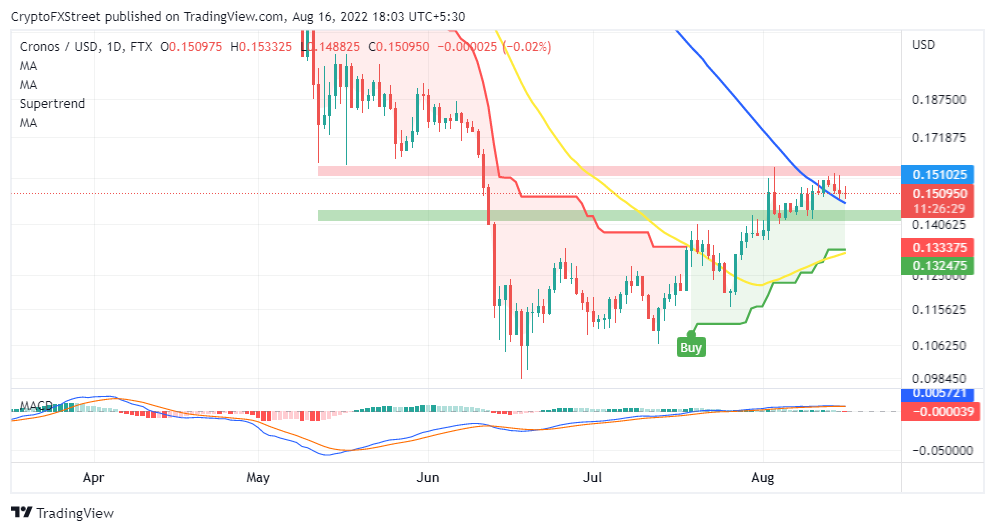
CRO/USD daily chart
On the brighter side, a bullish sequel is anticipated as long as the MACD holds within the positive region. The bullish divergence formed by the 12-day Exponential Moving Average (EMA) indicates that Crypto.com price is squarely in the buyers’ hands.
Reinforcing CRO’s imminent breakout is solid support underscored by IntoTheBlock’s IOMAP metric between $0.1416 and $0.1460. Around 3,080 addresses previously bought 2.92 billion CRO tokens in the range. If this anchor zone remains intact, bears will eventually give up their bid to push Crypto.com price down, leaving a clear path for gains to $0.5000 and $0.9140, respectively.
-637962552712439351.png)
Crypto.com IOMAP model
Although the run to $0.2000 seems easily achievable, Crypto.com price might encounter headwinds at $0.1578. According to the IOMAP model, 2,610 addresses previously scooped up 520 million CRO tokens around the same price zone. However, this resistance is significantly small compared to the extensive support, as analyzed above.
 [16.31.24, 16 Aug, 2022]-637962552628027207.png)
Crypto.com Supply Distribution
Despite CRO’s bullish technical outlook, traders should consider booking early profits at the upper range limit. Increased selling activities by large volume holders may dampen the move north. As seen on the chart above, investors with token holdings of between 1 million and 10 million currently account for 4.15% of CRO’s total supply, down from 4.93% over the last six months – a bearish indicator.
Author

John Isige
FXStreet
John Isige is a seasoned cryptocurrency journalist and markets analyst committed to delivering high-quality, actionable insights tailored to traders, investors, and crypto enthusiasts. He enjoys deep dives into emerging Web3 tren




