Why being an early buyer of the Solana price is unnecessary
- Solana price continues to print indecision candles on the 2-day chart.
- SOL price shows thought-provoking volume profile signals.
- Invalidation of the bearish downtrend remains a breach above $60.

Solana price from a risk to reward perspective is not a favorable digital asset to invest In. Here's what Solana needs to do to alter the bearish narrative.
Solana price is a scavenger's market
Solana price is one of the charts to consider observing from an academic standpoint but is still unfavorable for trading in the short term. It is quite uncertain where the SOL price wants to go next.
Let's do a recap. Since all-time highs at $258, Solana price is down 88%, currently trading at $34.50. The centralized smart contract token has endured a steep wave 3-like decline, which is the most challenging and riskiest scenario to call a market bottom. The 2-day chart confounds this idea as consecutive indecisive candlesticks have been established, showing consolidation without retaliation from bulls that may or may not be in the market.
Counter-trend scalping a steep decline can be rewarding but, at the same time, extremely dangerous to one's portfolio. Textbook Elliot Wave theory suggests waiting for a breach of a declining rallies wave 4 to confirm when a downtrend may be over. The previous wave 4 is at $60, which leaves a 70% upside potential for bullish counter-trend trades. But based on the nature of the previous declines, the SOL price could wipe out any short-term gains in an unexpected blink of an eye.
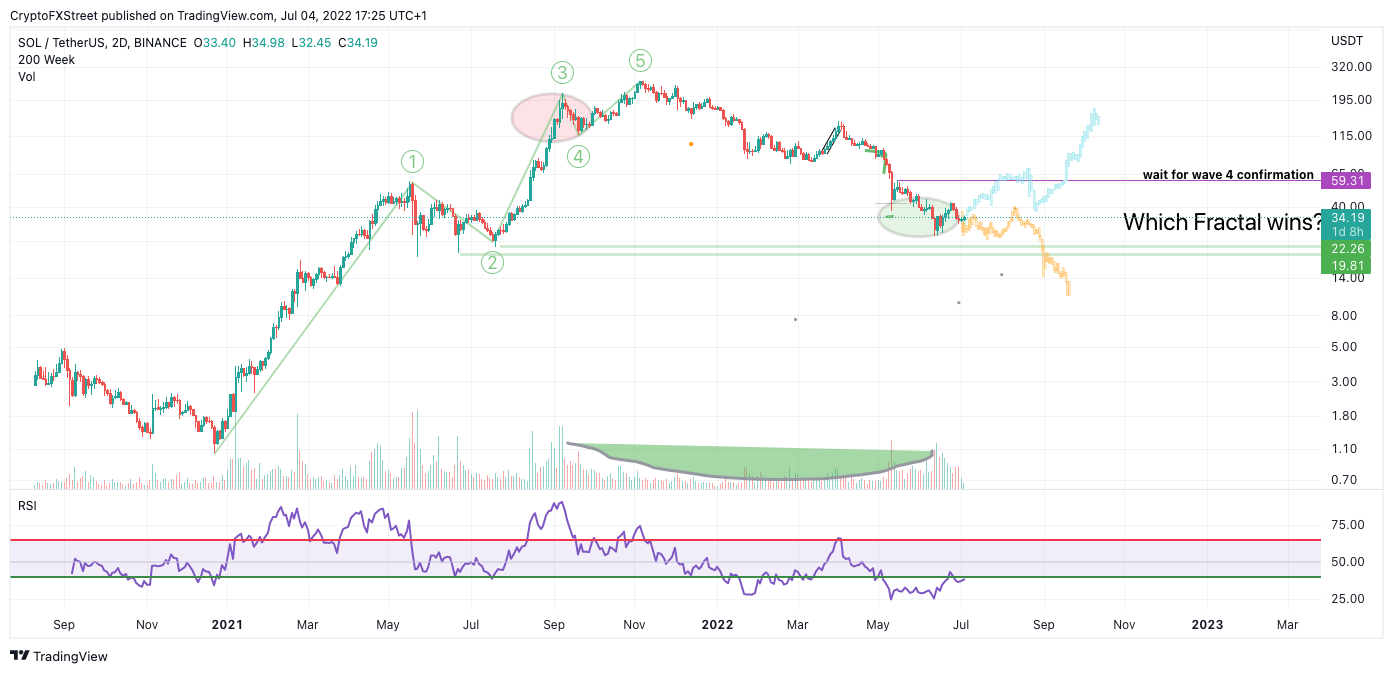
SOL/USDT 2-Day Chart (Wave fractals also from the 2-day Chart)
Solana price has shown anomalous volume patterns on the daily and monthly charts. There is no doubt that the SOL price is setting up for a powerful move. But, because wave 4 at $60 has not been breached yet, this thesis will remain bearish. Bearish targets of $20 and $15 remain highly possible for the Solana price in the coming months unless the breach occurs.
However, a breach of $60 could create a bullish market for the Solana price with targets in the $175 and $200 zones for up to a 500% increase from the current Solana price. Thus, there is no need to be an early bull scavenging 20-30% moves. Wait for wave 4 to get breached, a rally and a qualifiable pullback. This scenario will create a favorable market with plenty of bullish opportunities for traders, scalpers, and investors alike.
Author

Tony M.
FXStreet Contributor
Tony Montpeirous began investing in cryptocurrencies in 2017. His trading style incorporates Elliot Wave, Auction Market Theory, Fibonacci and price action as the cornerstone of his technical analysis.



