Where to buy MATIC before it pumps back to $1.70
- MATIC price has breached a daily trend line.
- Polygon price has seen increasing volume.
- Invalidation for the bullish thesis is a breach below $1.24.

MATIC price is displaying strong bullish indicators. Traders should be looking for entries as the price could rally an additional 20%.
MATIC price says, "trade what you see, not what you feel"
MATIC price displays vengeful price action that every professional trader loves to see. As noted by Sam Seiden at its most recent FX seminar, traders often have to change their minds on a whim, and there's nothing wrong with that. As Sam mentions in the seminar, "to be a successful trader, it is important to make trading decisions based on what you see and not what you feel."
Traders are likely on an emotional edge filled with doubt as nearly all cryptos have rallied 10% since the fake-out that occurred early on Monday. However, the MATIC price hints that the bulls are much stronger than just a 10% rally and more gains towards $1.70 for an additional 20% could occur.
MATIC price is setting up a textbook counter-trend rally. For one, the Polygon price broke through the lower half of the range on Monday and closed back in extreme bullish behavior, printing a large bullish engulfing candle at $1.419. The candle is now the largest within the downtrend and has a slight uptick in volume. The Relative Strength Index is also resting within the buyers' territory on the daily chart.
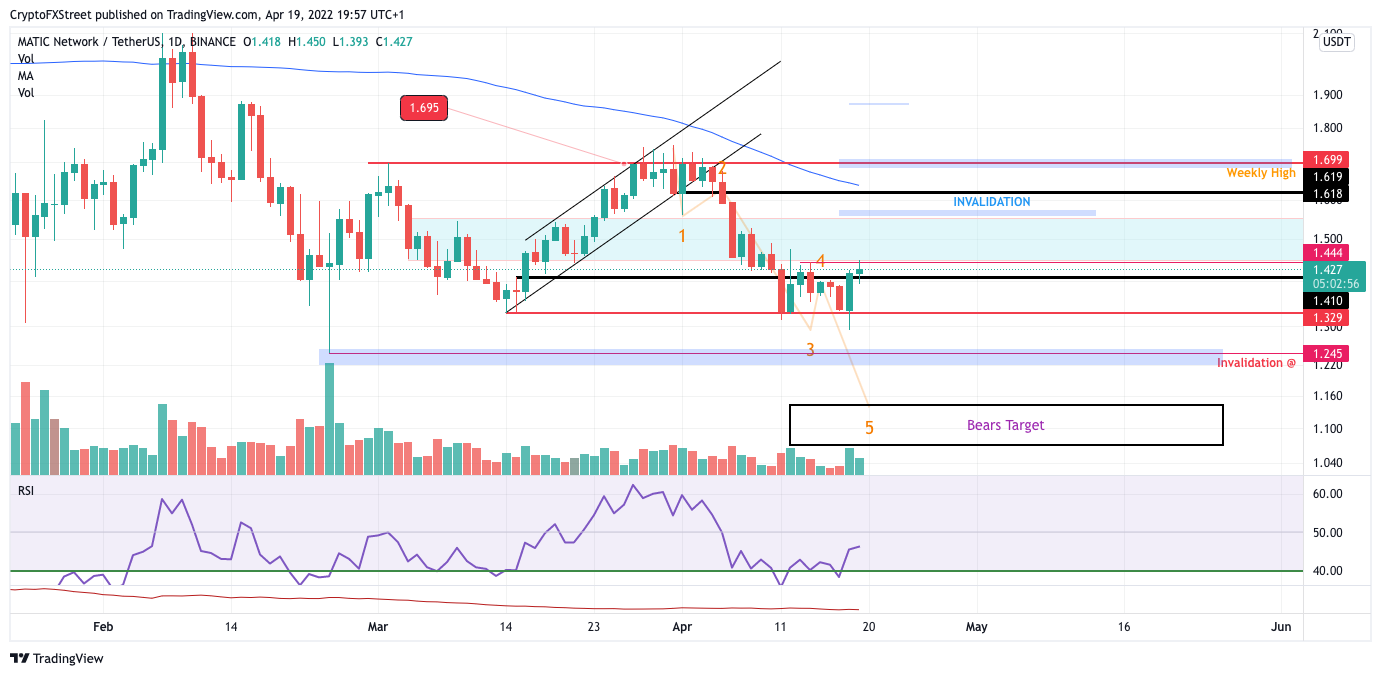
MATIC/USDT 1-Day Chart
Invalidation of the bullish thesis is a few ticks below the February 24th swing low at $1.24. MATIC price should under no circumstances breach this level to maintain a bullish bias. If this bearish scenario were to occur, the MATIC price could fall up to 20% back towards $1.14 to validate the early April bearish thesis.
Author
FXStreet Team
FXStreet
Composed of a group of economic journalists and FX experts, the FXStreet content team produces and oversees all content published on FXStreet. It provides a purely journalistic approach to the Forex market.


