When Might Bitcoin Be Ready To Resume Its Bull Trend?

Summary
- Potential Bull Flag continues to form, with Bitcoin falling as much as 52.9% from its 2019 peak.
- Nevertheless, a drop below the most recent low has Bitcoin next targeting the $5,900 to $5,427 price support zone.
- Recent weekly bearish moving average crossover adds to likelihood of further downside.
Bitcoin (BTC/USD) topped out at $13,868.44 in June of this year, thereby completing a 343.2% advance off the December 2018 corrective low of $3,128.89. That low ended a 1-year 84.3% decline off the bull market bubble top of around $19,892, reached in December 2017. Two weeks ago, Bitcoin completed a 61.8% Fibonacci retracement ($7,231.40) off the June high as it fell to a low of $6,526. That low put it 52.9% below the 2019 peak.
The price correction since the June high has been normal and well-constructed, forming a potential bull flag trend continuation pattern. This can be seen as the falling parallel trend channel in the enclosed charts.
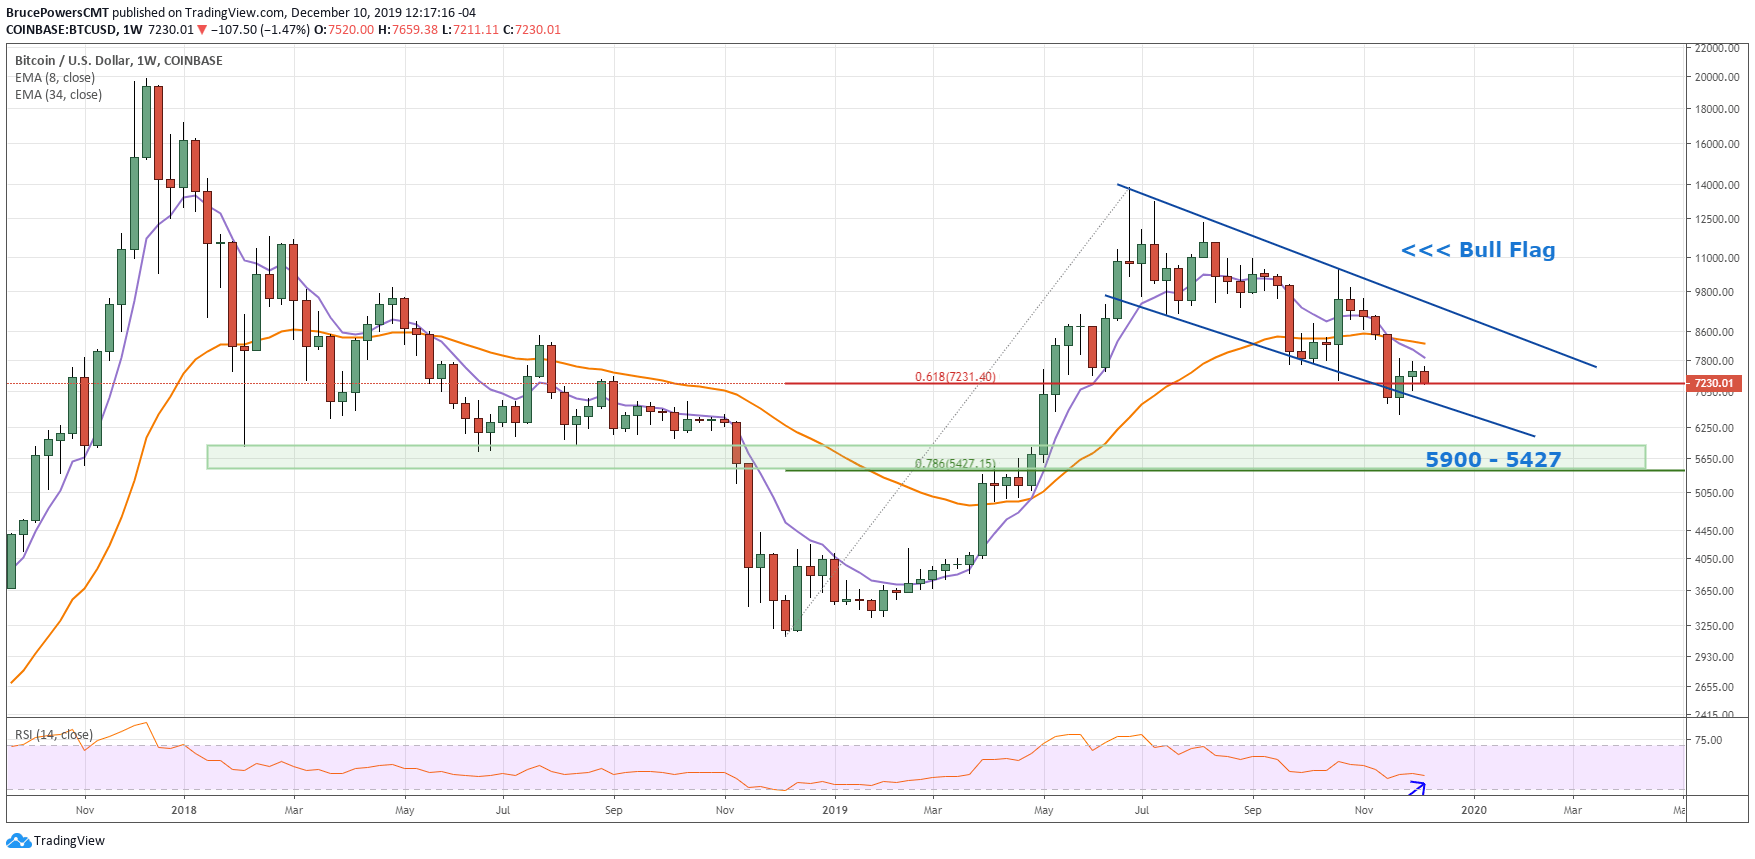
BTC/USD Weekly Chart
Given the significant advance in the first half of the year, and the related signs of a trend change from bearish to bullish, Bitcoin has a good chance of eventually triggering a continuation of the new bull trend. The 2019 rally exceeded several prior swing highs and the 10-week exponential moving average (ema) crossed back above the 34-week ema.
The question now is, has the bottom of the retracement been reached or might Bitcoin pullback further than it has so far? There’s no way to know this ahead of time but we can identify some important price levels to watch going forward.
As long as price stays above the $6,526 swing low, there is a chance for an upside breakout of the bull flag. If the falling trend channel is to further evolve and retain its general shape, a move up to at least the top trend line seems possible in the near-term.
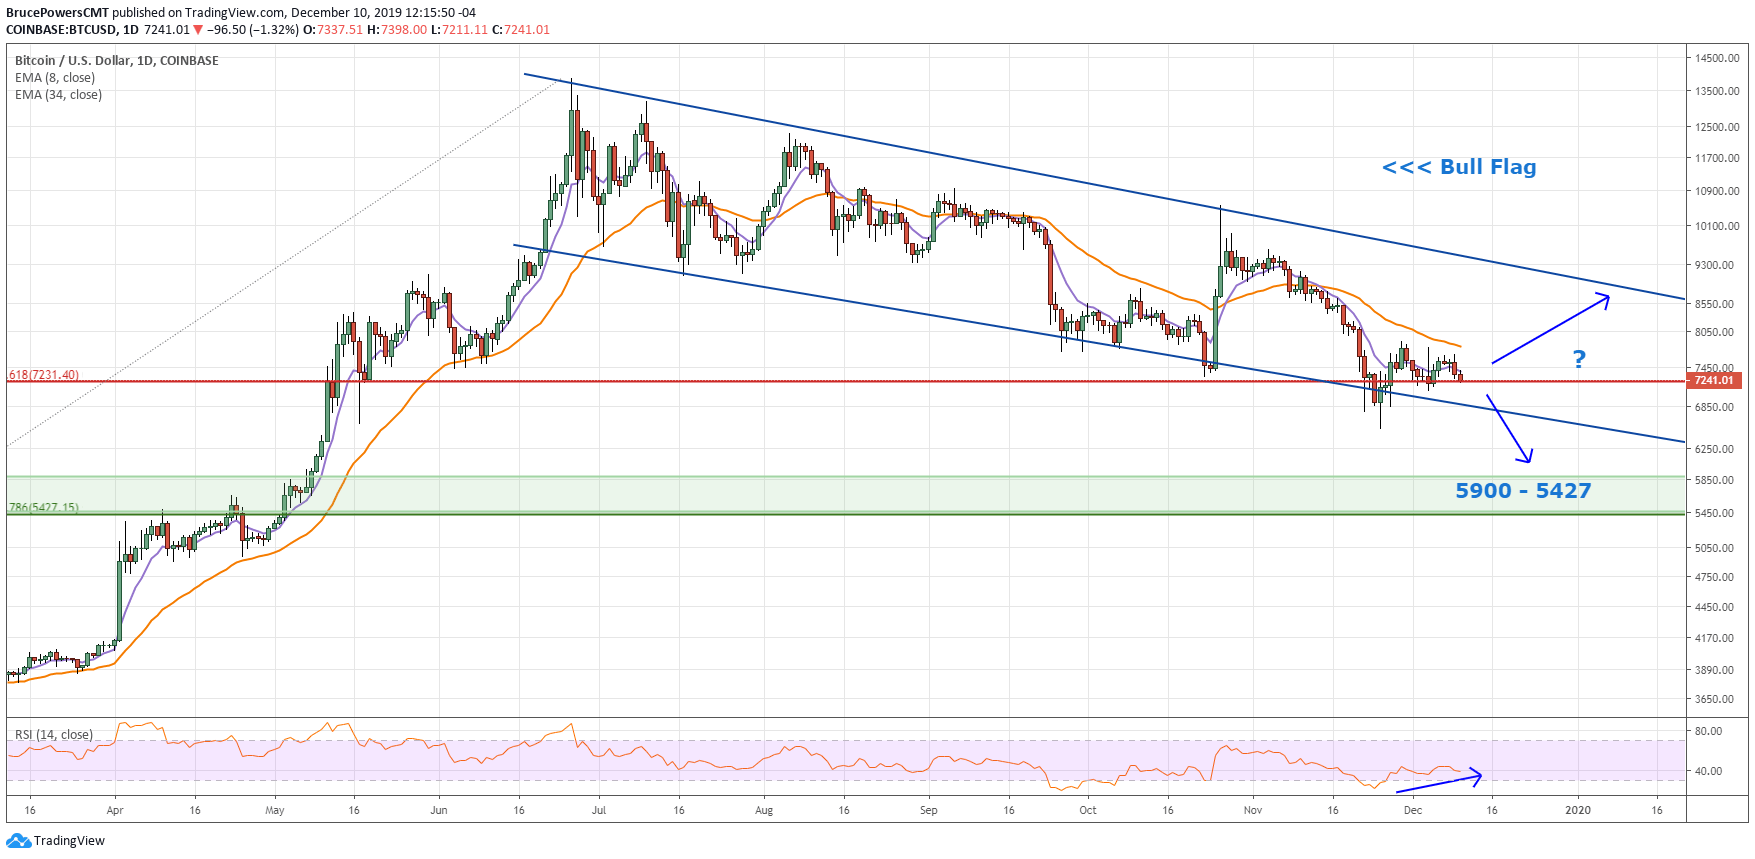
BTC/USD Daily Chart
A decisive daily close above the downtrend line is the first sign that a bullish breakout of the flag could be in the works. At that point, additional signs of strength will be needed. Watch for a daily close above the most recent swing high of $10,540.49 for confirmation of a bullish breakout. There is also a monthly high at $9,600 from November. Bitcoin has not had a move above a prior month high since the June peak. A move above a prior month high would be an additional sign of a change in the downtrend pattern, to an uptrend.
Alternatively, notice that the 10-week ema has just crossed below the 34-week ema, after being above it since early-May. By itself this is bearish, and supports a bearish scenario if Bitcoin falls below the most recent swing low, thereby triggering a continuation of the downtrend off the 2019 high. If that occurs, next watch for signs of support around the $5,900 to $5,427 (78.6% Fibonacci retracement) price zone, and then for indications of a bottom and subsequent bullish reversal.
Author

Bruce Powers, CMT
Markets Today
Bruce Powers, CMT, is a global markets technical analyst covering stocks, market indices, and ETFs, cryptocurrencies, Forex, oil and metals.