What this first step from Ripple’s XRP price means for holders?
- XRP price triggered a quick-run up between July 7 and 8, indicating an affinity to move higher.
- Although this move retraced, the chances of continuing this run-up to $0.387 and $0.439 are high.
- A four-hour candlestick close below $0.286 will invalidate the bullish thesis for Ripple.

XRP price is trying to stabilize above the midpoint of a recently formed range, so it can trigger a run-up. The buyers and bullish momentum also seem to be in place, indicating that Ripple is ready for a move higher.
XRP price ready to make some noise
XRP price rallied roughly 8% between July 7 and July 8, triggering a breakout above the $0.336 level. This barrier is the midpoint of the $0.286 to $0.387 range that was formed when the remittance token initially rallied 35% between June 18 and June 24.
The most recent spike in bullish momentum has pushed XRP price above a pivotal point indicating that it wants to move higher. Although the altcoin has retraced, it is trying to stabilize above this level.
If successful, interested investors can open long positions and expect XRP price to first sweep the liquidity resting above $0.387. Once the first target is achieved market participants can either choose to book profits or hold their position for the retest of the next level at $0.439.
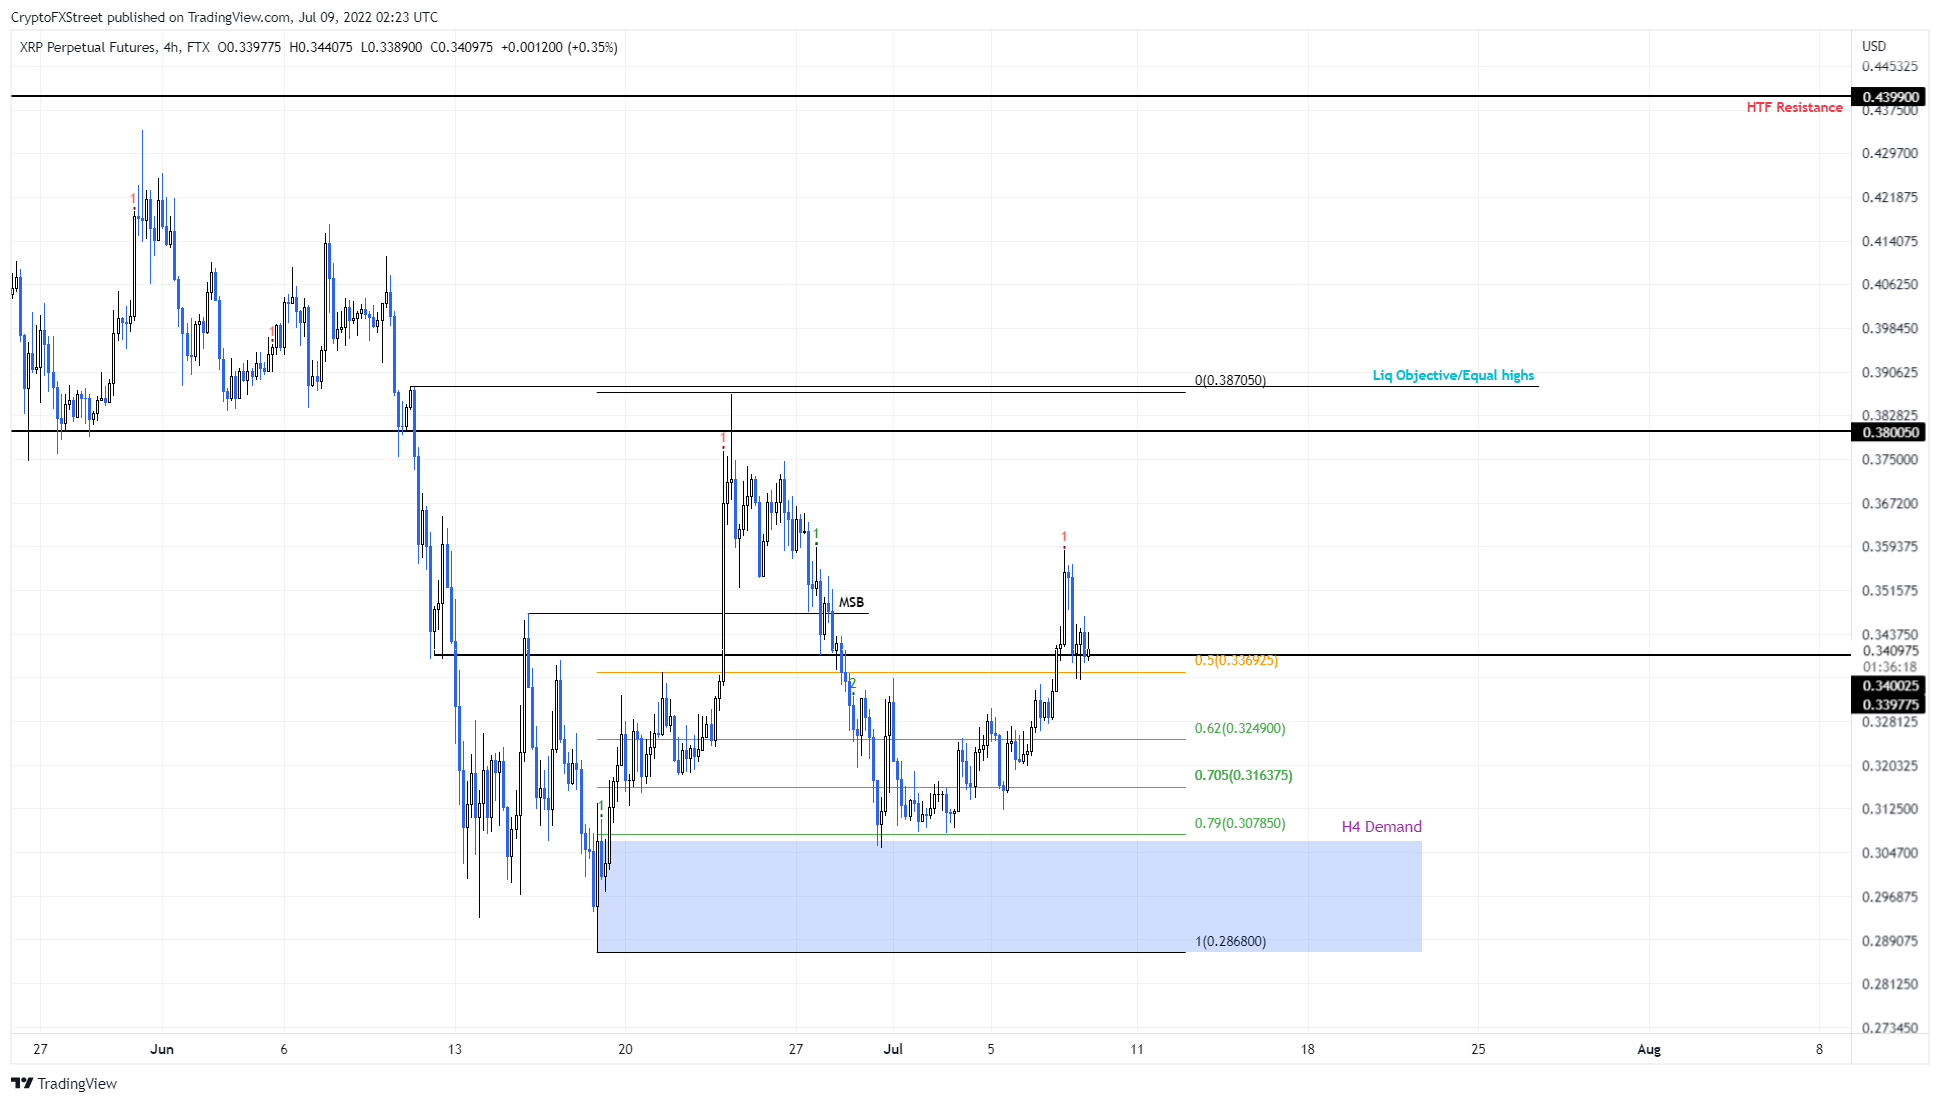
XRP/USDT 4-hour chart
On the other hand, if XRP price fails to stay above $0.336, it will indicate that the buyers are weak and an uptrend or recovery rally is unlikely. In such a case, if XRP price produces a four-hour candlestick close below the range low at $0.286, it will invalidate the bullish thesis for Ripple.
Author

Akash Girimath
FXStreet
Akash Girimath is a Mechanical Engineer interested in the chaos of the financial markets. Trying to make sense of this convoluted yet fascinating space, he switched his engineering job to become a crypto reporter and analyst.


