|

Waves Price Analysis: WAVES sell-off gains traction, bears target at $5

  • Waves is vulnerable to further losses with the critical bearish target of $5.
  • A recovery above $8.7 is needed to invalidate the bearish forecast.

Waves has been one of the best-performing altcoins recently. The coin bottomed at $2 in early October and hit the highest level of 2020 at $9.37. However, the token has run out of luck. The price lost over 14% amid profit-taking and market positioning in less than a week and dropped below $8.

At the time of writing, the 30th largest digital asset is changing hands at $7.9, while technical indicators on the long-term time frames imply that the worst is not over yet.

Waves bears are here to stay

The TD Sequential indicator sends a sell signal on Waves weekly chart. The bearish formation presented in the form of a green nine candlestick implies that the growing selling pressure may see prices develop from one to four red candlesticks on the weekly chart with the initial target at $5. This former resistance was verified as a support at the end of November. A sustainable move below this area will be a catastrophe for the coin as there is no viable support until $3.7.
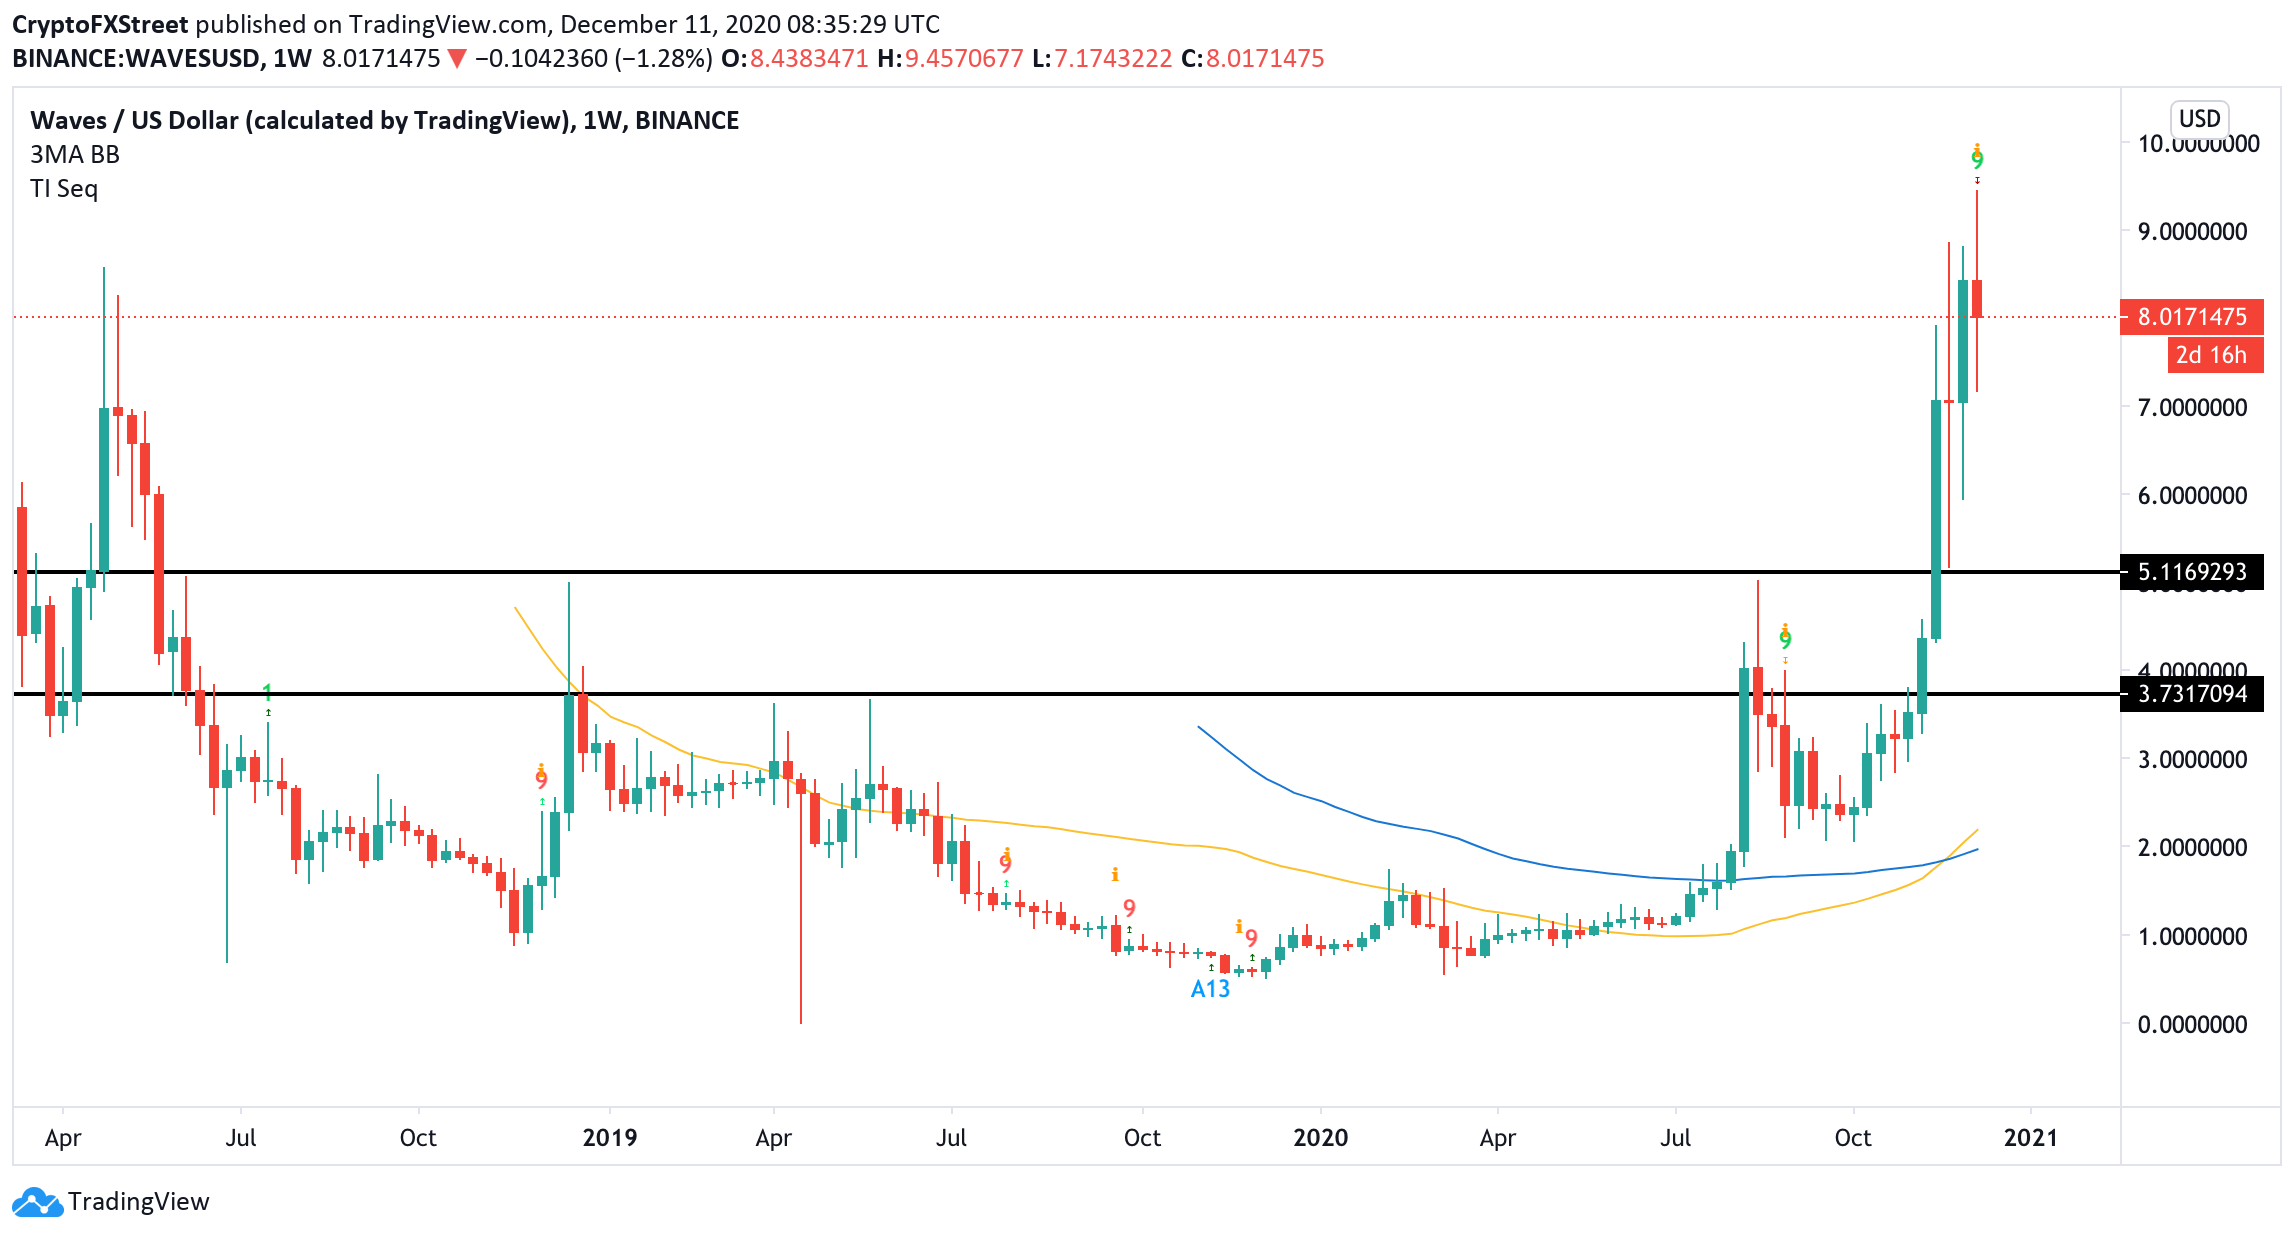
WAVES weekly chart

WAVES weekly chart

On the 12-hour time frame, there is local support around $7 created by the 50 EMA. If it gives way, the sell-off will continue towards the above-mentioned long-term target of $5, which is also reinforced by 12-hour 100 EMA. 
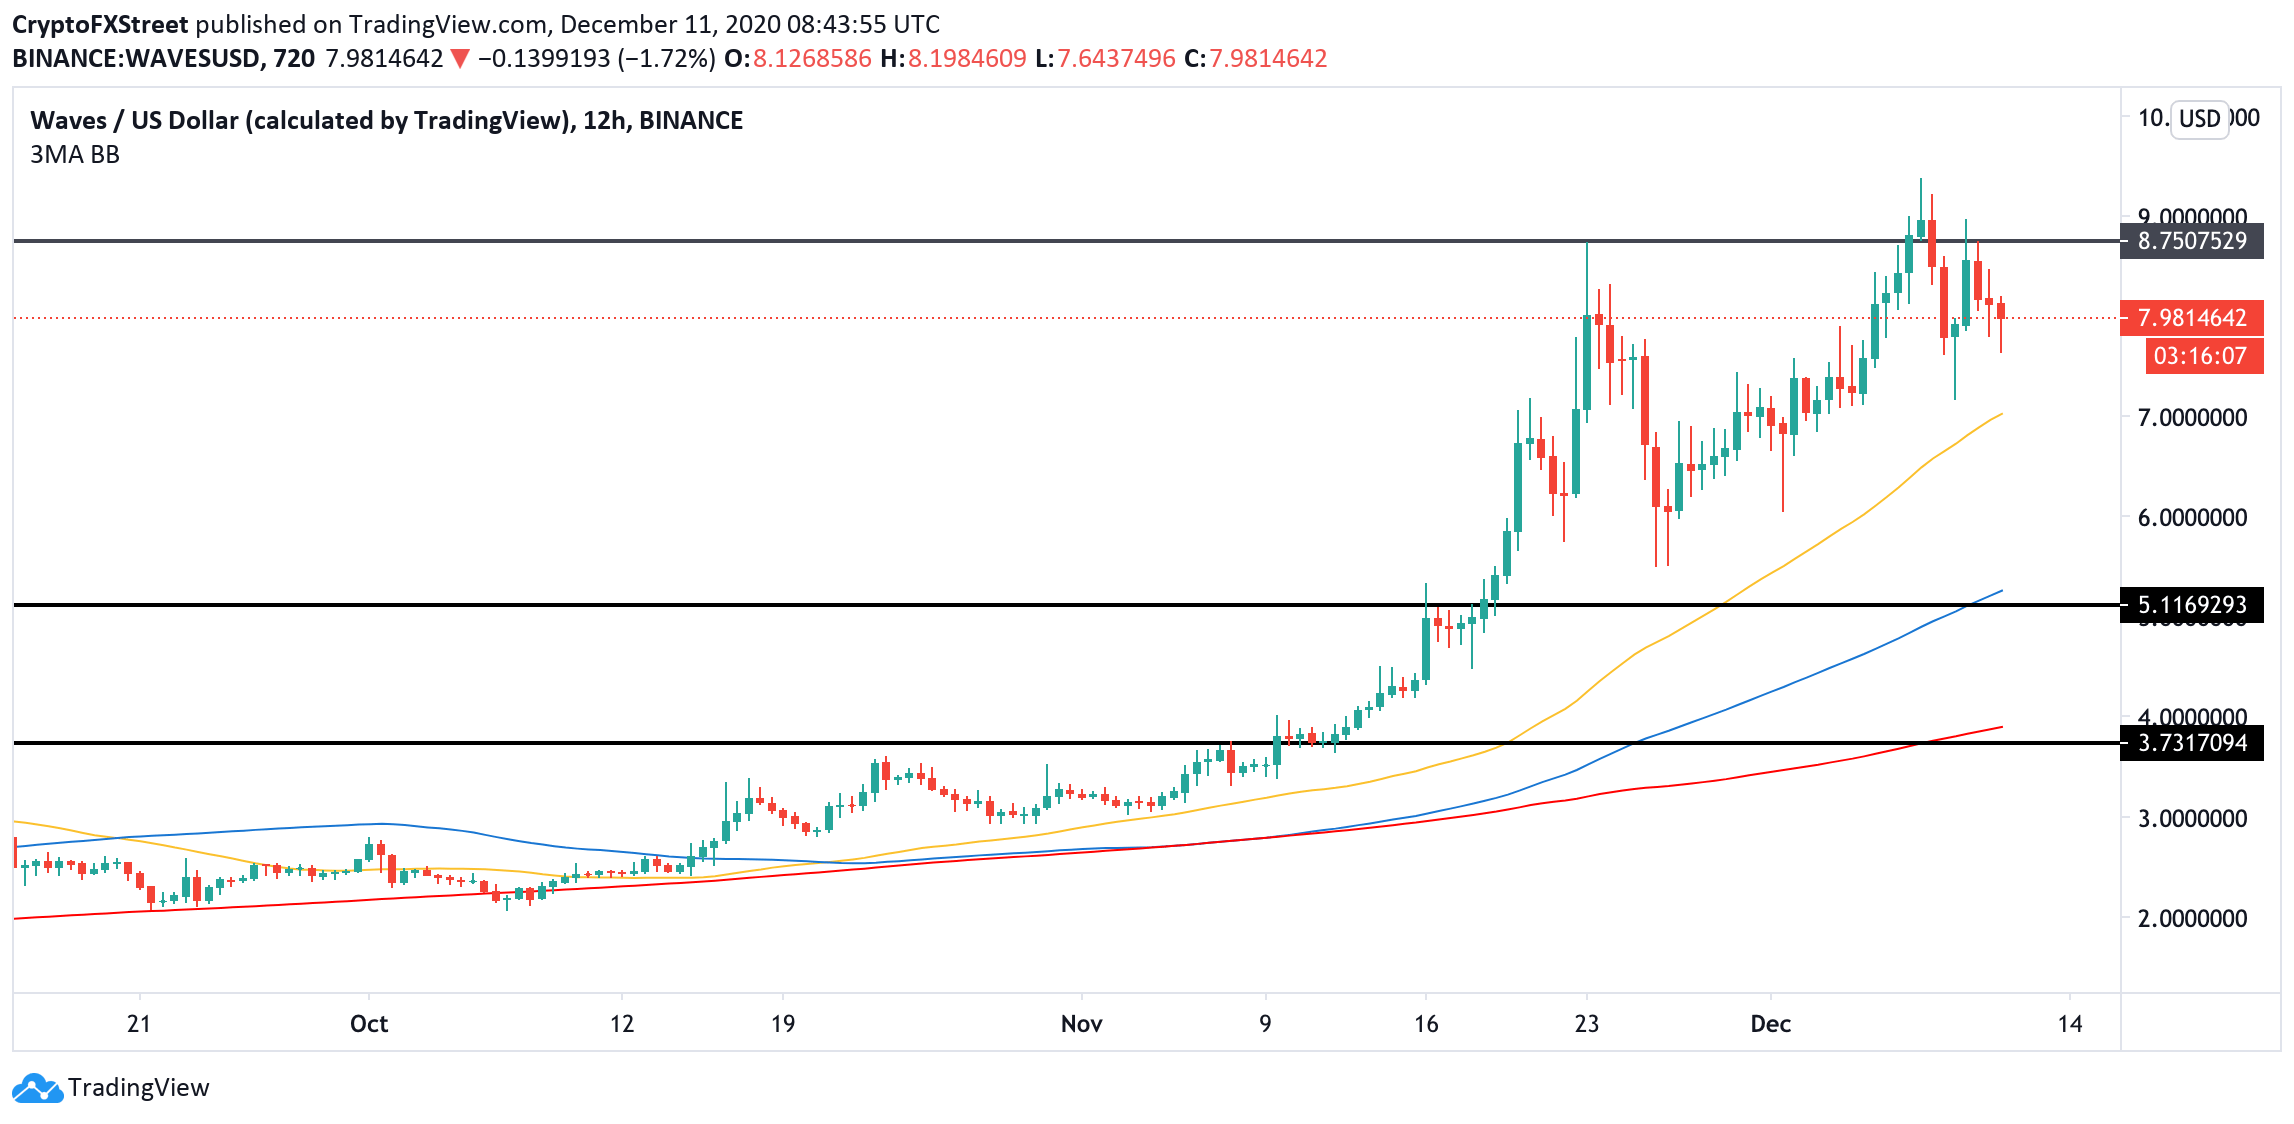
WAVES 12-hour chart

WAVES 12-hour chart

On the upside, the local resistance comes on approach to $8.7. This barrier served as resistance on November 23 and also stopped the recovery attempt on December 10. The technical barrier may slow down the upside momentum and push the price back inside the current range. A sustainable move above this area will negate the immediate bearish forecast and bring the 2020 high at $9.37 back into focus. 

Author

Tanya Abrosimova

Tanya Abrosimova

Independent Analyst


More from Tanya Abrosimova
Share:

Editor's Picks

XRP pressured by weak ETF flows and declining retail interest

Ripple (XRP) is edging lower, trading above its intraday low of $1.32 at the time of writing on Tuesday. The decline from its weekly opening of $1.39 reflects heightened volatility in the broader cryptocurrency market, accentuated by tariff-triggered uncertainty.

Crypto Today: Bitcoin, Ethereum, XRP come under renewed pressure amid ETF outflows, tariff uncertainty

Bitcoin, Ethereum and Ripple are trading under increasing selling pressure at the time of writing on Tuesday, as market participants navigate renewed tariff uncertainty. The Crypto King holds above $63,000, down 2% intraday from its $64,656 open.

Bitcoin falls to two-week low as ETF outflows, tariff chaos weigh

Bitcoin price extends losses on Tuesday, ending a two-week consolidation phase. Risk-on sentiment fades amid growing uncertainty over Trump’s tariffs and rising US-Iran tensions, increasing downside risks toward $60,000.

Sui Price Forecast: SUI capitulates under pressure, opens the door to $0.70

Sui (SUI) declines by 3% at press time on Tuesday, extending the downside breakout of a short-consolidation range confirmed the previous day. Retail sentiment is bearish, as evidenced by increased long liquidations and a sharp drop in the funding rate. 

Bitcoin Price Annual Forecast: BTC holds long-term bullish structure heading into 2026

Bitcoin (BTC) is wrapping up 2025 as one of its most eventful years, defined by unprecedented institutional participation, major regulatory developments, and extreme price volatility.

Bitcoin: No recovery in sight

Bitcoin (BTC) price continues to trade within a range-bound zone, hovering around $67,000 at the time of writing on Friday, and falling slightly so far this week, with no signs of recovery.