VORTECS™ Spotlight: Fantom’s 500%+ rally was signalled by this key trading metric

This key trading metric alerted traders to FTM’s bullish outlook on each turn of the altcoin’s parabolic 500% rally.
Fantom’s FTM asset has been one of the top trending tokens of the week, and it barely noticed Bitcoin’s (BTC) midweek swoon that halted many altcoin rallies. Despite Bitcoin’s price dropping below $43,000, FTM has added 114% in U.S. dollar terms and 127% in its BTC pair over the last seven days.
FTM’s monthly stats look even more impressive, with nearly 500% growth against both benchmarks. While it is par for the course for altcoins to rally when Bitcoin consolidates, FTM’s price movement is completely asymmetrical to most of its peers.
Let’s investigate what’s behind the record-breaking run and whether there is a way for traders to determine if the rally has the potential to continue.
Current growth drivers
Fantom is a layer-one smart-contract platform that boasts its own high-speed consensus mechanism and modular architecture that is designed to make it compatible with any distributed ledger.
The platform has seen explosive growth in its user activity over the last few months, with the number of unique wallet addresses increasing by 5,700% from May to August and the number of daily transactions rising to hundreds of thousands.
As Cointelegraph reported, decentralized finance (DeFi) activity within the Fantom ecosystem has been surging as well, spurred by a hefty incentive program that contributed to an almost 20% rise in the total value locked on the blockchain just 24 hours after launch.
These fundamental advances led FTM to rally from $0.30 a month ago to above $1.80 at the time of writing.
The early bird gets the worm
Price charts were not the only rankings that FTM dominated this week; the token also did extremely well in terms of its VORTECS™ Score, an algorithmically generated metric that compares the observed patterns of market conditions around the coin against years of historical data.
This quantitative-style metric is able to assess whether an asset’s outlook is bullish, bearish or neutral for the next 12 to 72 hours. The indicator is exclusively available to the subscribers of Cointelegraph’s data intelligence platform, Markets Pro.
It seems that the combination of market activity and social sentiment parameters that preceded FTM’s recent spikes resembled the patterns that came prior to price spikes in the past. This is why the coin posted an ultra-high VORTECS™ Score of 90 this week — a value indicating the algorithm’s tremendous confidence that in the past, the observed conditions consistently came up shortly before dramatic price increases.
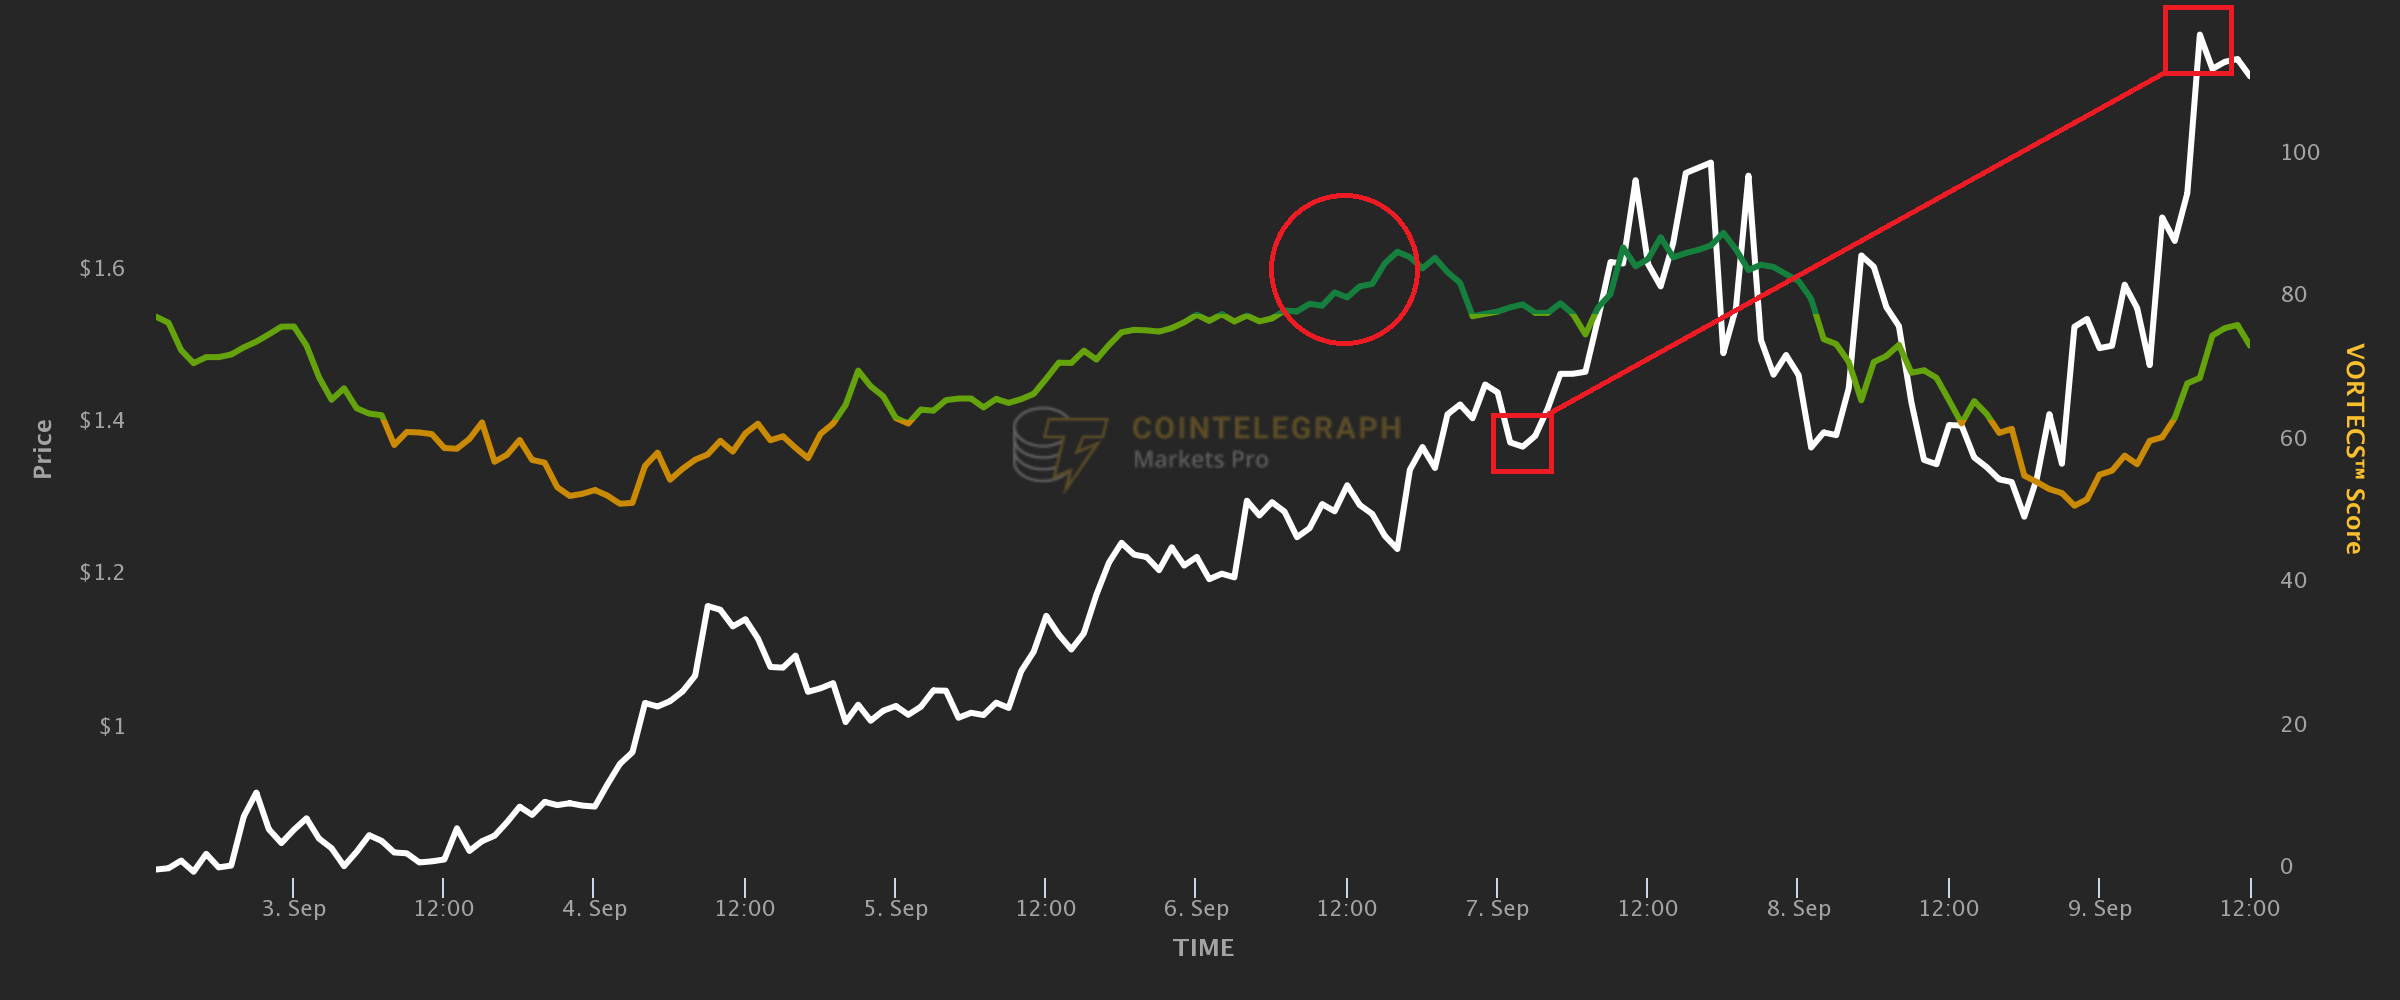
FTM price vs. VORTECS™ Score. Source: Cointelegraph Markets Pro
As can be seen in the chart above, the asset’s VORTECS™ line turned dark green (corresponding to values above 80) on Sept. 6 against a price of $1.30. By that time, the asset had already made sizable gains, so traders were likely uncertain as to whether it was still a good time to invest in the altcoin.
Yet, the historically favorable conditions captured by a streak of strong VORTECS™ Scores were so robust that FTM confidently continued its upward run. As mentioned earlier, the altcoin was even relatively unfazed by the 16% dip in BTC price on Sept. 8. And by Sept. 9, FTM conquered a new all-time high above $1.80.
The data doesn't lie
Crypto assets vary in the extent to which their price rallies resemble those in the past, in terms of market and social activity metrics. FTM belongs to a group of tokens that demonstrate consistent behavior on these key indicators before their prices go up.
Since early 2021, FTM has recorded 34 days during which its VORTECS™ Score hit a value of 80 or higher, a result bested by only six other coins. When the asset scores high, it usually sees gains in the next 72 hours. Out of 34 days with a VORTECS™ Score of 80+, FTM generated a return of at least 3% on 27 occasions and at least 5% on 23 occasions. The data also shows FTM generating a return of 10% or more on 20 occasions.
On average, the coin’s price increased by 0.2% after 48 hours and by 3.6% after 72 hours of reaching a score of 80. FTM also reached the ultra-high VORTECS™ Score of 90 on multiple occasions, adding an average of 3.7% after 48 hours and 5.3% within 72 hours of hitting this threshold.
While a high VORTECS™ Score is not a prediction of price movement, it can give traders some actionable ideas regarding the health of an asset’s outlook and also alert them to opportunities that they wouldn’t otherwise consider.
Author

Cointelegraph Team
Cointelegraph
We are privileged enough to work with the best and brightest in Bitcoin.



