VeChain Price Prediction: Can bulls recover after six consecutive days of losses?
- VeChain price has lost 10% of market value in the last six days.
- VET's uptrend has the potential to rally toward the $0.034 level.
- Invalidation of the bullish thesis would arrive from a break below $0.021

VeChain price has experienced a recent market decline but still appears to have the potential for a bullish uptrend.
VeChain price consolidating as a potential buying opportunity?
VeChain price has declined nearly 10% over the last six days, marking the longest declining streak for the token in 2023. Despite the profit-taking move, VET’s technicals are still in line with the overall bullish uptrend. The Relative Strength Index (RSI) suggests that the uptrend rally, which is 80% above its origin point at $0.015, still has the potential to extend higher.
VeChain's current trading price is $0.027. The RSI broke into overbought conditions last week when the price rose into the mid-$0.03 zone after nearly two weeks of consolidation within the low $0.02 zone. Furthermore, a bullish divergence is displayed at current price levels compared to the previous range, near $0.022. Bullish divergences on the RSI are common reversal signals as they are known to catalyze strong counter-trend surges.
Based on the analysis, the next bullish target for VeChain lies near the $0.03 level to challenge liquidity dating back to August of 2022. The bullish scenario creates the potential for a 20% increase from VET's current market value.
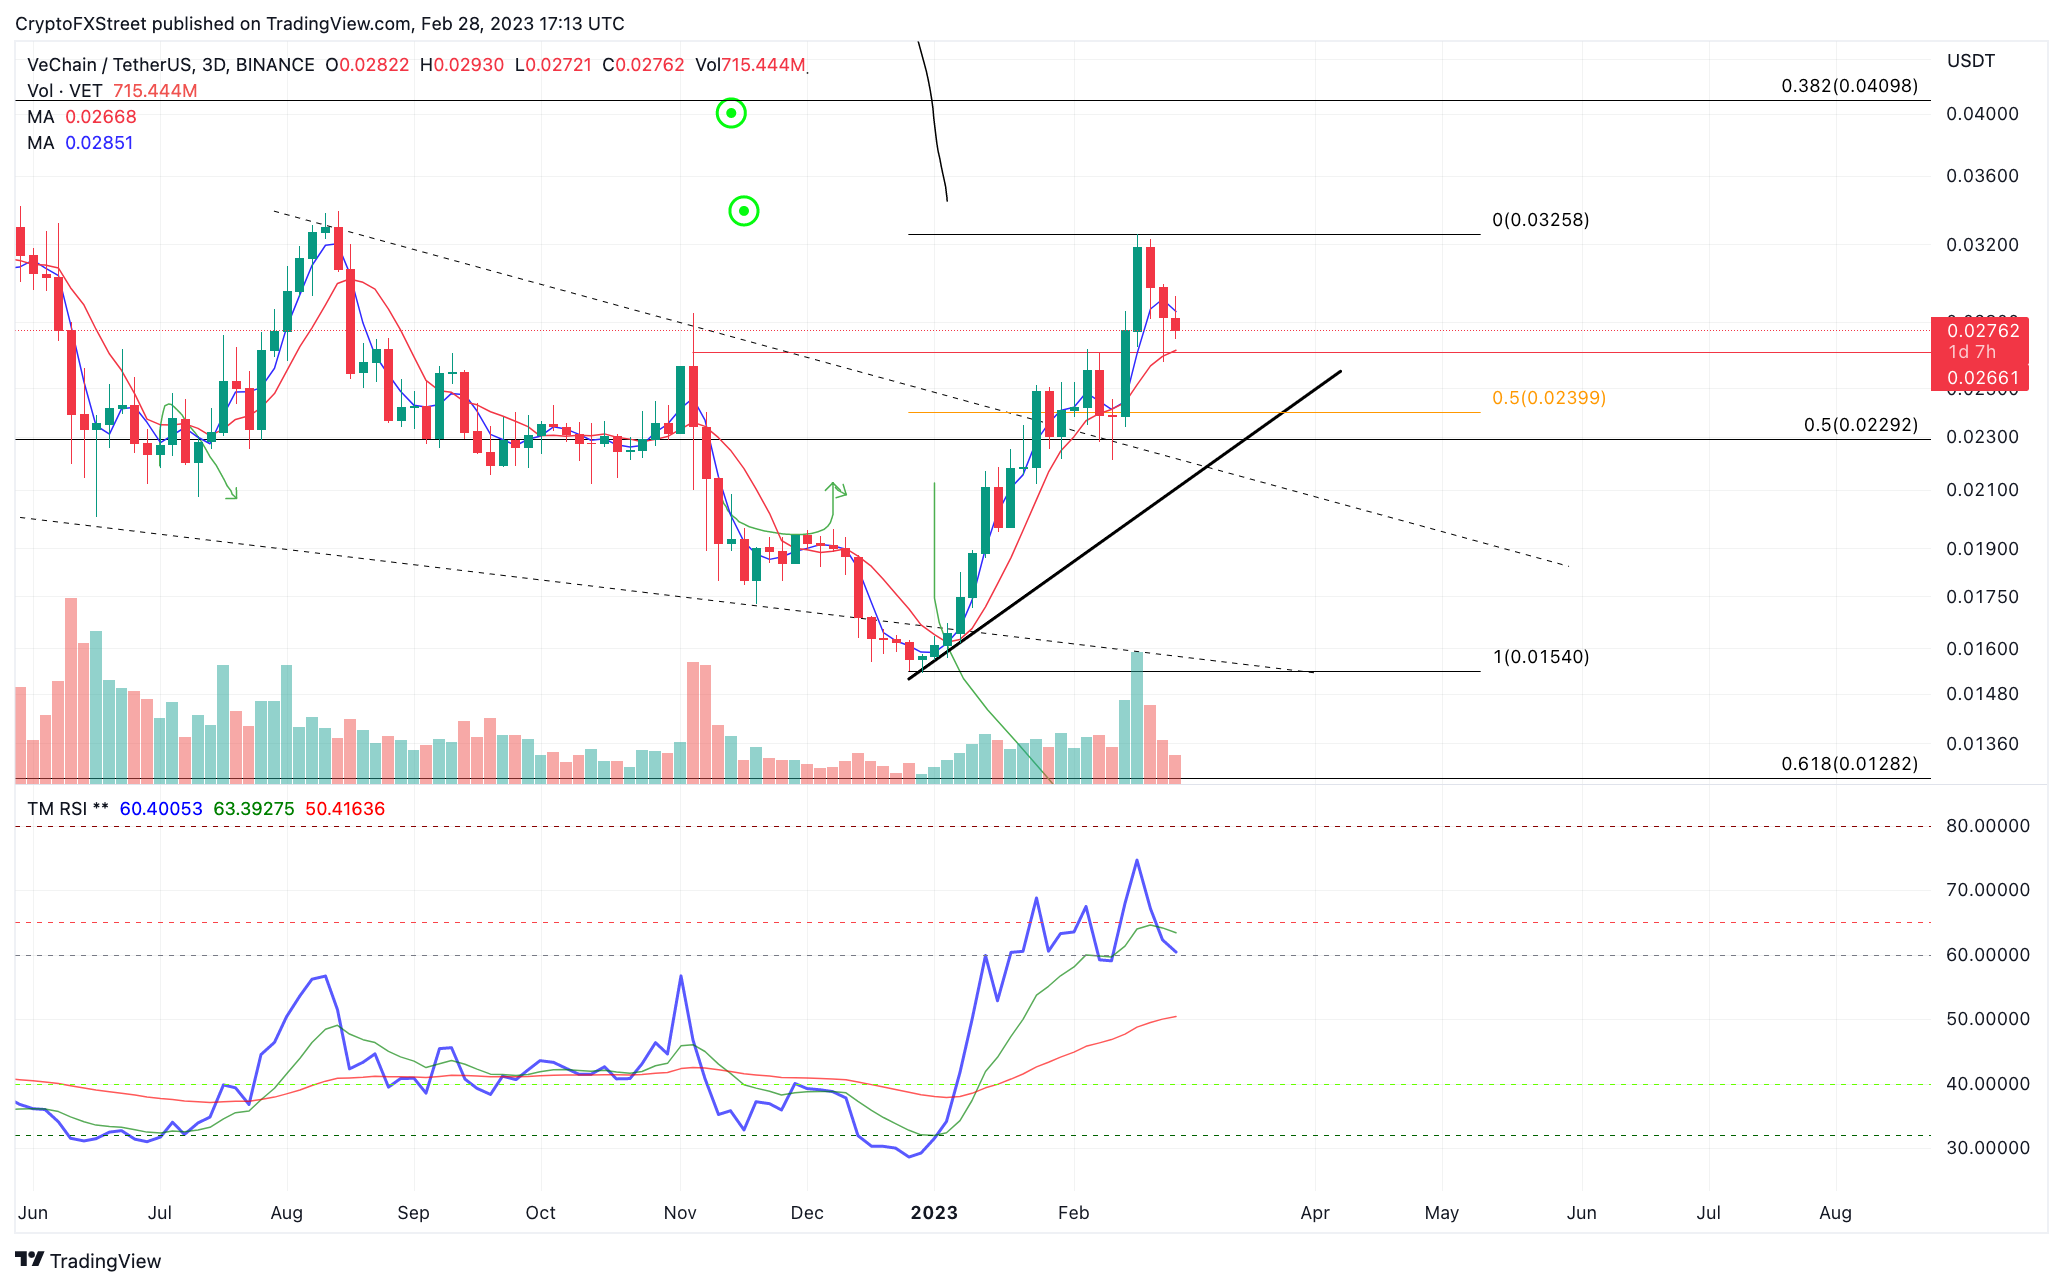
VET/USDT 3-day chart
Invalidation of the bullish thesis would arise from a break below the three-day bullish engulfing candle that broke through the previous two-week trading range at $0.021. If the bears breach this level, the VET price could decline 50% to 61.8% of the winter rally. The bearish scenario would create the potential for a 20% drop, targeting liquidity levels as low as $0.019.
Author

Tony M.
FXStreet Contributor
Tony Montpeirous began investing in cryptocurrencies in 2017. His trading style incorporates Elliot Wave, Auction Market Theory, Fibonacci and price action as the cornerstone of his technical analysis.




