VeChain price looks ready to explode toward $0.04 for these reasons
- VeChain price is showing a steepening trend after rallying over 10% in November.
- VET price shows an uptick in transactions on the Volume Profile Indicator after the Relative Strength Index reached overbought conditions.
- A breach below $0.021 will invalidate the bullish thesis.

VeChain price validated last month's bullish trade idea. Traders who partook in the move may be enticed to aim for extended targets as the technicals show a strong bullish presence. Key levels have been defined to gauge VET's next potential move.
VET price can continue higher
VeChain price shows tempting bullish signals as the VTHO-powered blockchain is inching away from a breakout. Last month, a bullish trade idea was issued on October 19, suggesting VET could rally 15%, which could be a part of a larger move towards $0.04. On Saturday, November 5, the bulls accomplished the first half of the trade idea, rallying 16% to a new monthly high at $0.02638.
VET price currently auctions at $0.02628, just below the newfound monthly high, as a strong bullish surge has commenced after a weekend decline. An uptick in bullish transactions accompanies the surge in the Volume Profile Indicator. The Relative Strength Index (RSI) also displays the new monthly high as extremely overbought.
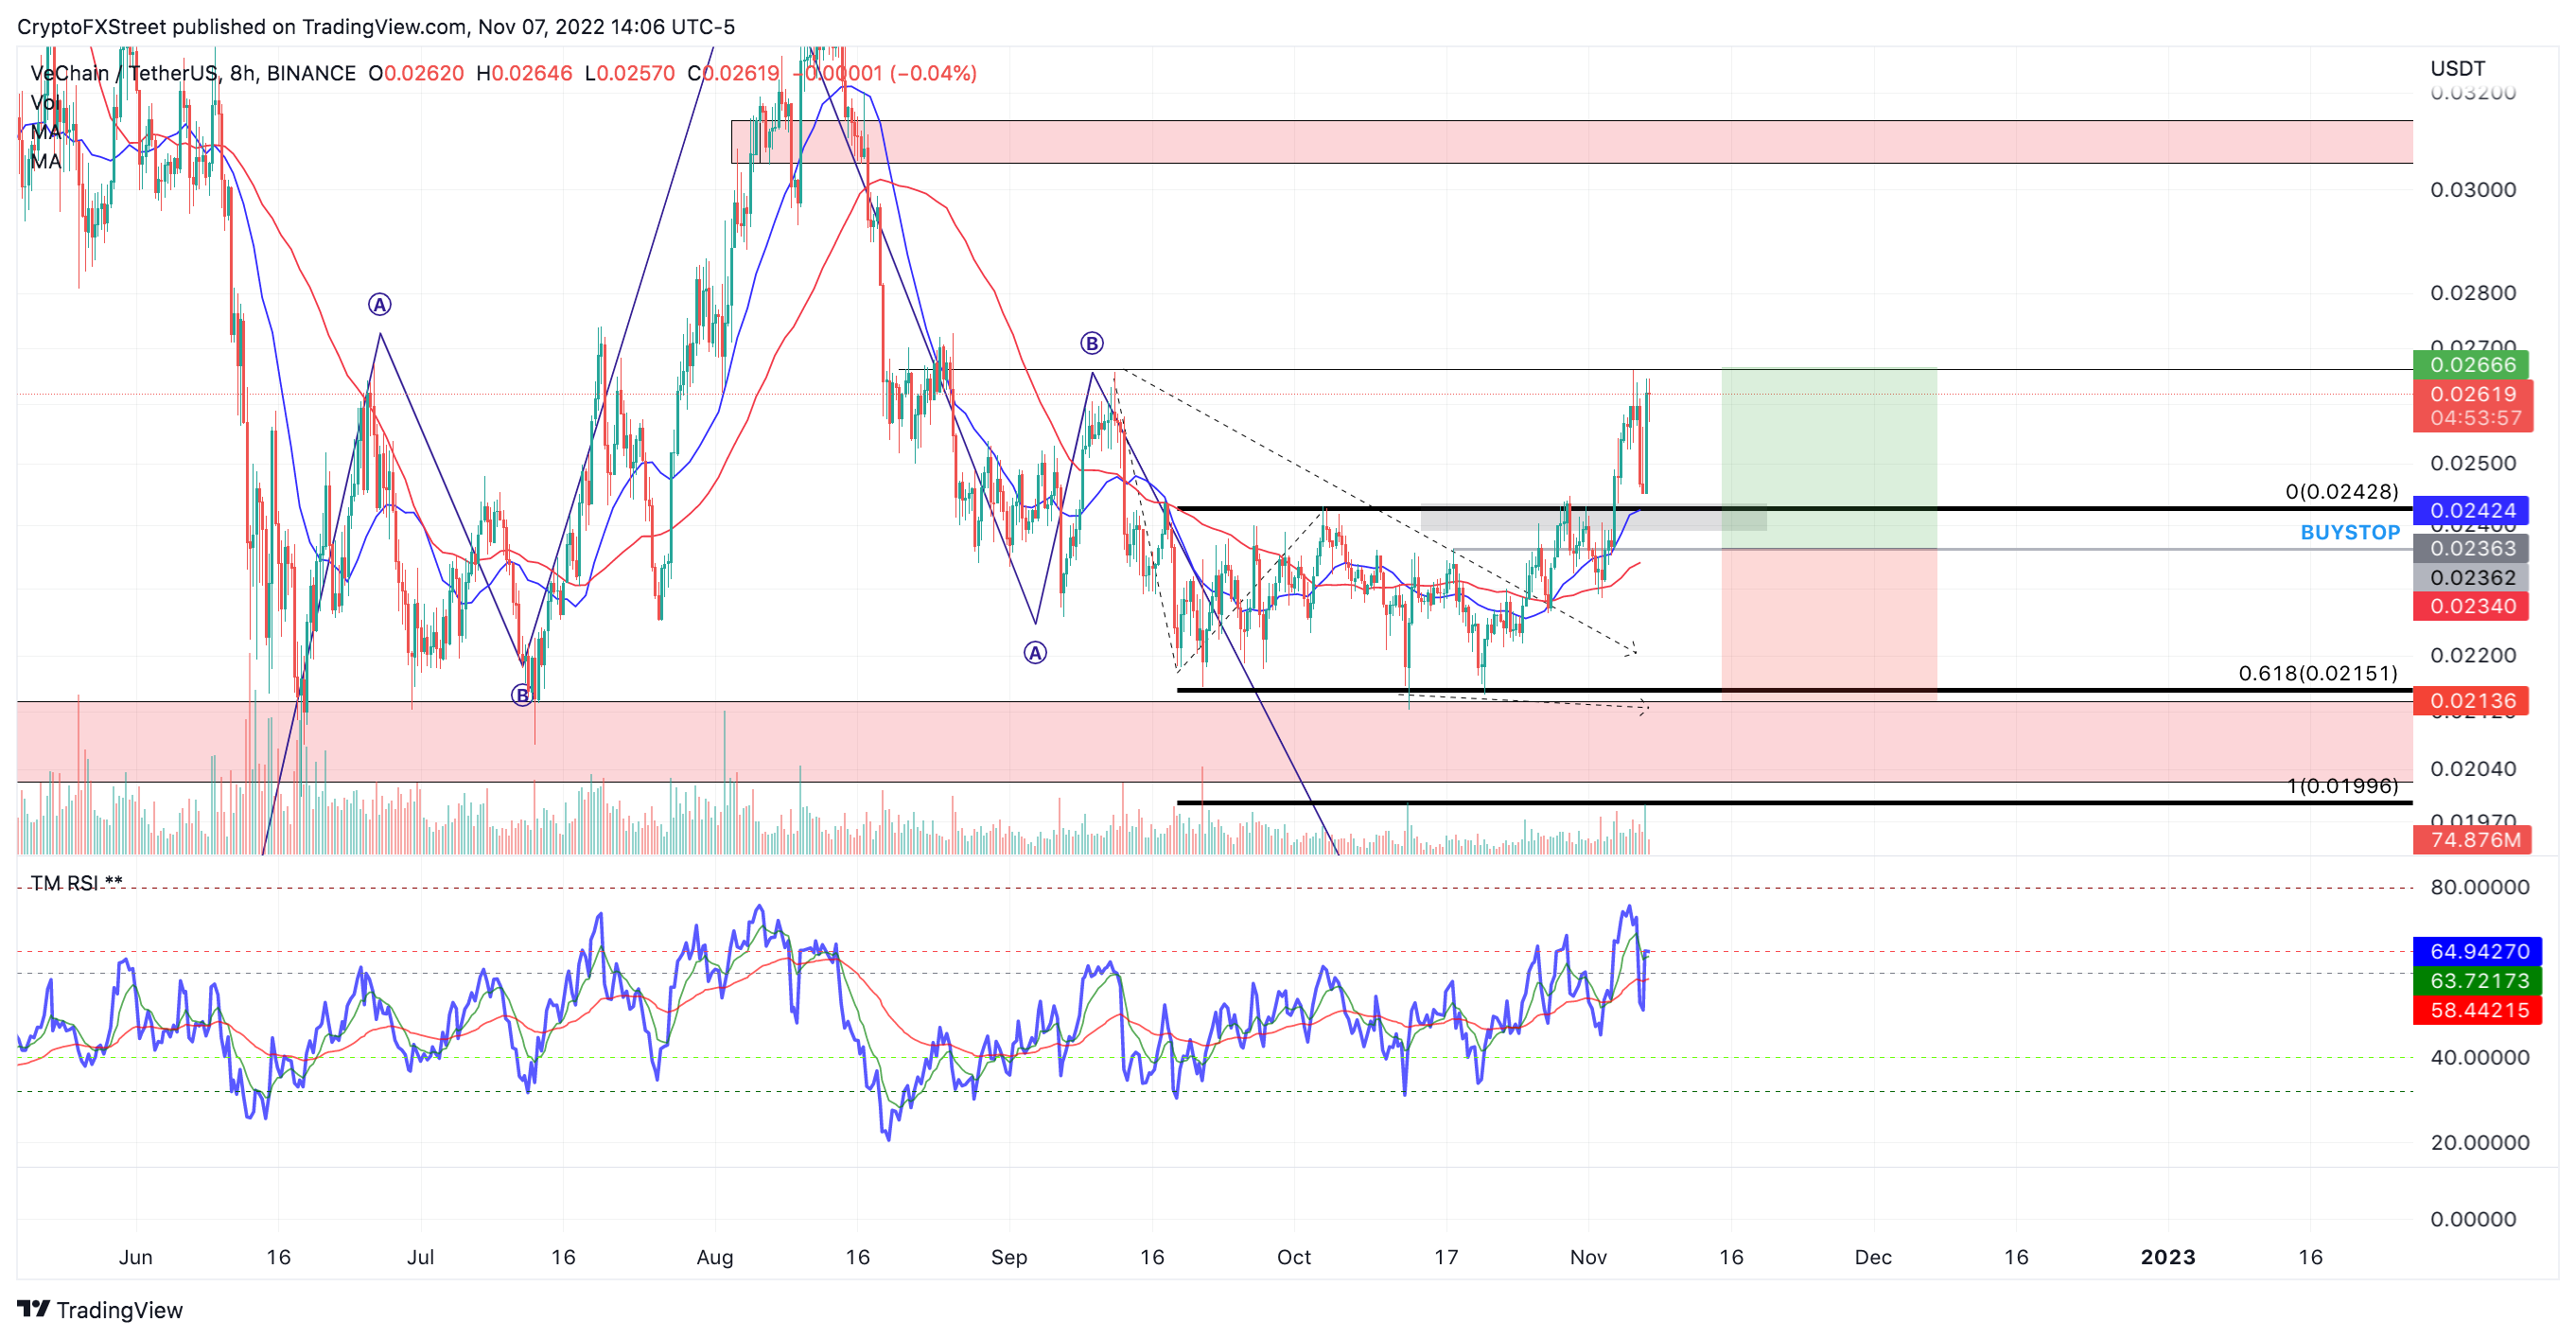
VET/USDT 8-Hour Chart
Combining these factors, VET's technicals could be genuinely bullish. If market conditions persist, a rally toward $0.031 will be the next pit stop before reaching the $0.04 target zone.
Invalidation of the uptrend thesis remains below the swing low at $0.021 as per last month's thesis. Traders in profit could move to break even while looking for more entries. If the invalidation is tagged, the bears could re-route south, targeting the $0.018 liquidity levels. Such a move would result in a 30% decrease from the current VeChain price.
In the following video, our analysts deep dive into the price action of VeChain, analyzing key levels of interest in the market. -FXStreet Team
Author

Tony M.
FXStreet Contributor
Tony Montpeirous began investing in cryptocurrencies in 2017. His trading style incorporates Elliot Wave, Auction Market Theory, Fibonacci and price action as the cornerstone of his technical analysis.


