VeChain Price Prediction: Bearish clouds thicken ahead of a 10.64% drop in VET price
- VeChain price is considering a 10.64% drop below a bearish rectangle pattern.
- Investor sentiment flips negative, increasing the risk of an extended downtrend.
- The 50-day and the 100-day SMAs keep VET price suppressed within the confines of the rectangle.

VeChain price is much closer to a breakout after staying in consolidation for nearly six weeks. Due to the choppy market movement in VET price, a rectangle pattern formed on the 12-hour chart. For now, all eyes are fixated on its ability to escape this sideways price action.
VeChain price eyes one more crash to $0.0194
A bearish rectangle pattern appeared on the 12-hour chart as VET respected an upper range limit at $0.0243 and a lower one at $0.0217. This pattern displays a period of consolidation and indecision between the bulls and bears.
VeChain price is expected to keep testing the horizontal support and resistance numerous times before it eventually breaks out. The bearish rectangle comes into play when sellers take a breather during a downtrend, allowing for consolidation.
A breakout is expected in the direction of the preceding trend before consolidation. In the case of VET that trend was bearish and a 10.64% decline is expected to occur to $0.0194 – a distance equal to the rectangle's width. It is recommended that traders wait for the price to confirm a break below the pattern's support at $0.0217 before triggering their sell orders.
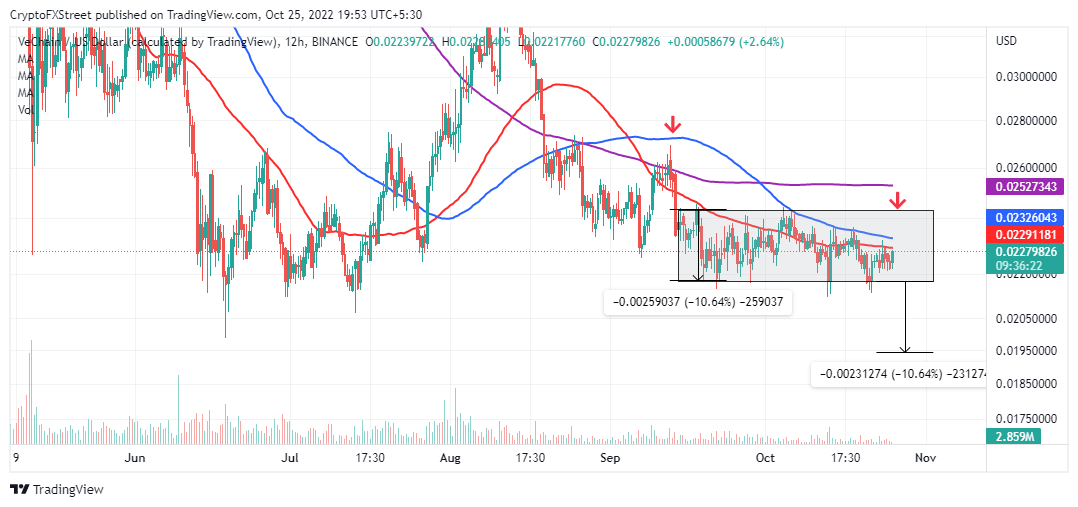
VET/USD 12-hour chart
The 50-day SMA (Simple Moving Average) (in red) at $0.0229 and the 100-day SMA (in blue) at $0.0232 will likely keep thwarting the bulls' battle for a bullish outcome north of the rectangle resistance. Furthermore, the 200-day SMA (in purple) could annihilate movement above the pattern, precisely around $0.0252.
 [17.23.49, 25 Oct, 2022]-638023103487738704.png)
VeChain on-chain volume chart
VeChain price is also facing a massive decline in on-chain activity, especially considering the transaction volume. Looking at the chart below, only 35.34 million VET tokens have exchanged addresses compared to a six-month peak of $631.55 million, as recorded on May 12. For this reason, chances of recovery in the VeChain price have been diminishing. Thus, adding credence to the expected bearish move.
 [17.23.52, 25 Oct, 2022]-638023102937728912.png)
VeChain Positive Sentiment
The positive commentary surrounding VET across multiple social media channels also suffered a considerable drop, as elucidated in the chart above. This drop indirectly shows that investors are taking a hands-off approach to VeChain price and are unlikely to beef up buying activities until the token sustains a northbound price action. Hence, the foreshadowed move to $0.0194 will likely occur in the short term.
Author

John Isige
FXStreet
John Isige is a seasoned cryptocurrency journalist and markets analyst committed to delivering high-quality, actionable insights tailored to traders, investors, and crypto enthusiasts. He enjoys deep dives into emerging Web3 tren



