Vechain price deteriorates, leaving VET exposed to a 35% decline
- VeChain price death cross raises the probabilities of additional weakness moving forward.
- VET may be shaping a head-and-shoulders pattern on the twelve-hour chart, projecting a test of the May 23 low.
- Recent volume structure reveals increasing distribution after a period of inactivity.

VeChain price is down 7% today at the time of writing, unable to build on yesterday’s rally of 6%, creating a further deterioration of the overall price structure. The potential head-and-shoulders topping pattern manifests the weakening price structure and clarifies the levels to be monitored for VET direction confirmation.
VeChain price searches for catalyst, as Bitcoin bounce proves unsustainable
On June 3, after reaching the apex of a symmetrical triangle, VeChain price executed a breakout that was quickly followed by a bearish outside bar on the twelve-hour chart, reflecting distribution. The VET setback occurred just above the intersection of the 50 twelve-hour simple moving average (SMA) at $0.138, with the 61.8% Fibonacci retracement of the May correction at $0.140. The reversal soon was confirmed with a death cross on the twelve-hour chart.
VeChain price followed the twelve-hour reversal bar with a 20% decline into the May 8 low with a mild rise in volume, nearing the 50-day average. The ongoing VET rebound has been blocked by the 50 twelve-hour SMA at $0.122, potentially forming the peak of the right shoulder of a head-and-shoulders pattern.
The pattern symmetry would be best served with additional price strength to get the right shoulder closer in line with the height of the left shoulder. VeChain price could reach the 200 twelve-hour moving average at $0.134 before printing the right shoulder peak, thereby bettering the pattern symmetry.
The head-and-shoulders neckline is now obvious and currently resides at $0.100. A break below would trigger the pattern and make VeChain price vulnerable to a measured move decline of almost 37%, placing VET at $0.063 and below the May 23 low at $0.065. The left shoulder’s low at $0.092 may present some support.
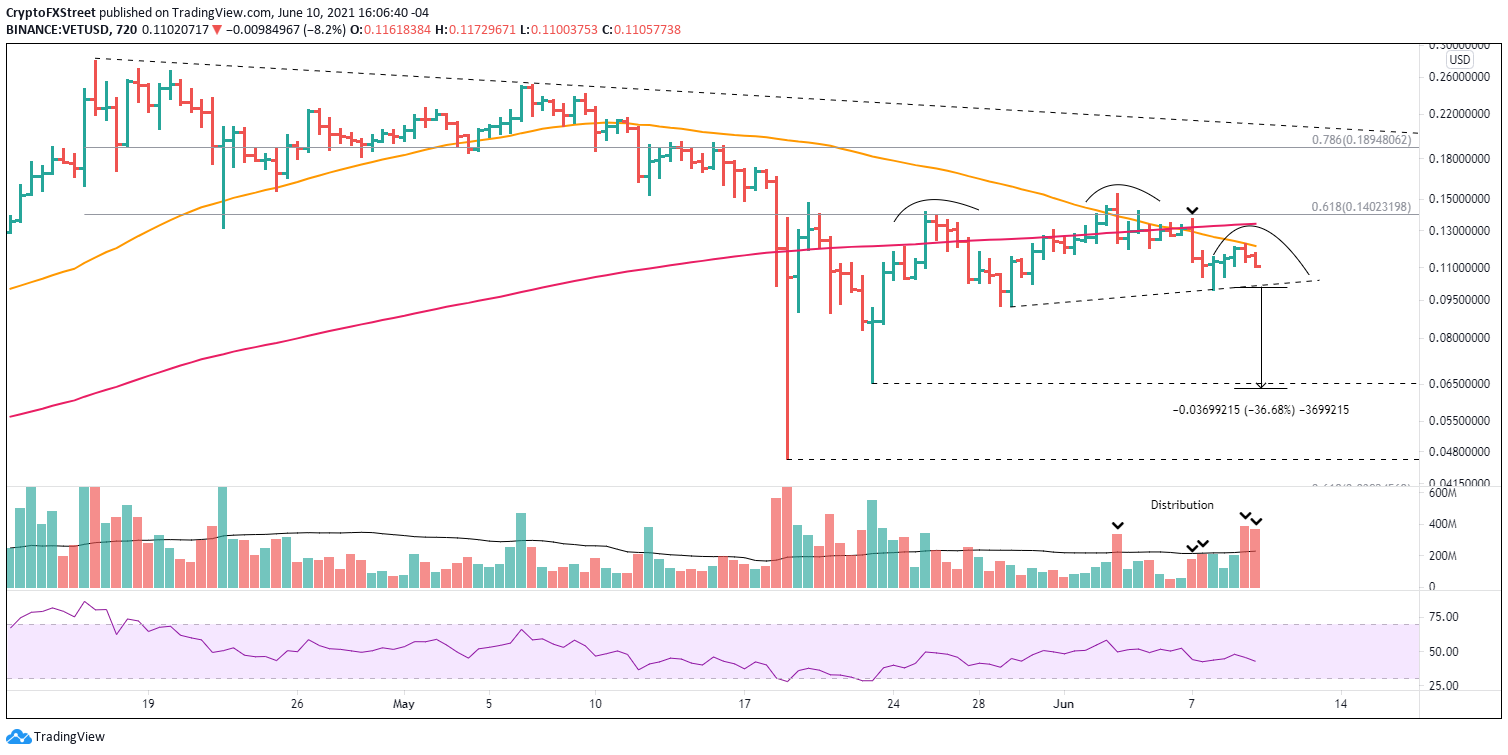
VET/USD 12-hour chart
VeChain price faces several technical challenges to overturn the deteriorating price structure. VET needs to convincingly dispose of the 50 twelve-hour SMA at $0.121, the 200 twelve-hour SMA at $0.134 and secure a daily close above the 61.8% retracement of the May decline at $0.140.
VeChain price is swayed by the forces of the cryptocurrency complex and not by concerns specific to it. Thus investors should be prepared for uncertain price action moving forward until either the neckline breaks or VET closes above the 61.8% retracement level.
Author

Sheldon McIntyre, CMT
Independent Analyst
Sheldon has 24 years of investment experience holding various positions in companies based in the United States and Chile. His core competencies include BRIC and G-10 equity markets, swing and position trading and technical analysis.


