VeChain price at risk of a pullback as technicals spell trouble for the bulls
- VeChain price is facing significant selling pressure in the short term.
- The TD Sequential indicator has just presented a strong sell signal on the daily chart.
- VET does not have substantial support on the way down.

VeChain price is up by 70% in the recent two weeks, hitting a new all-time high of $0.147 on April 10. However, the digital asset seems poised for a correction after such a colossal rally.
VeChain price faces significant selling pressure
On the daily chart, the TD Sequential indicator has just presented a sell signal in the form of a green ‘9’ candlestick. VET is bound for a correction after a massive 70% rally in the last two weeks.
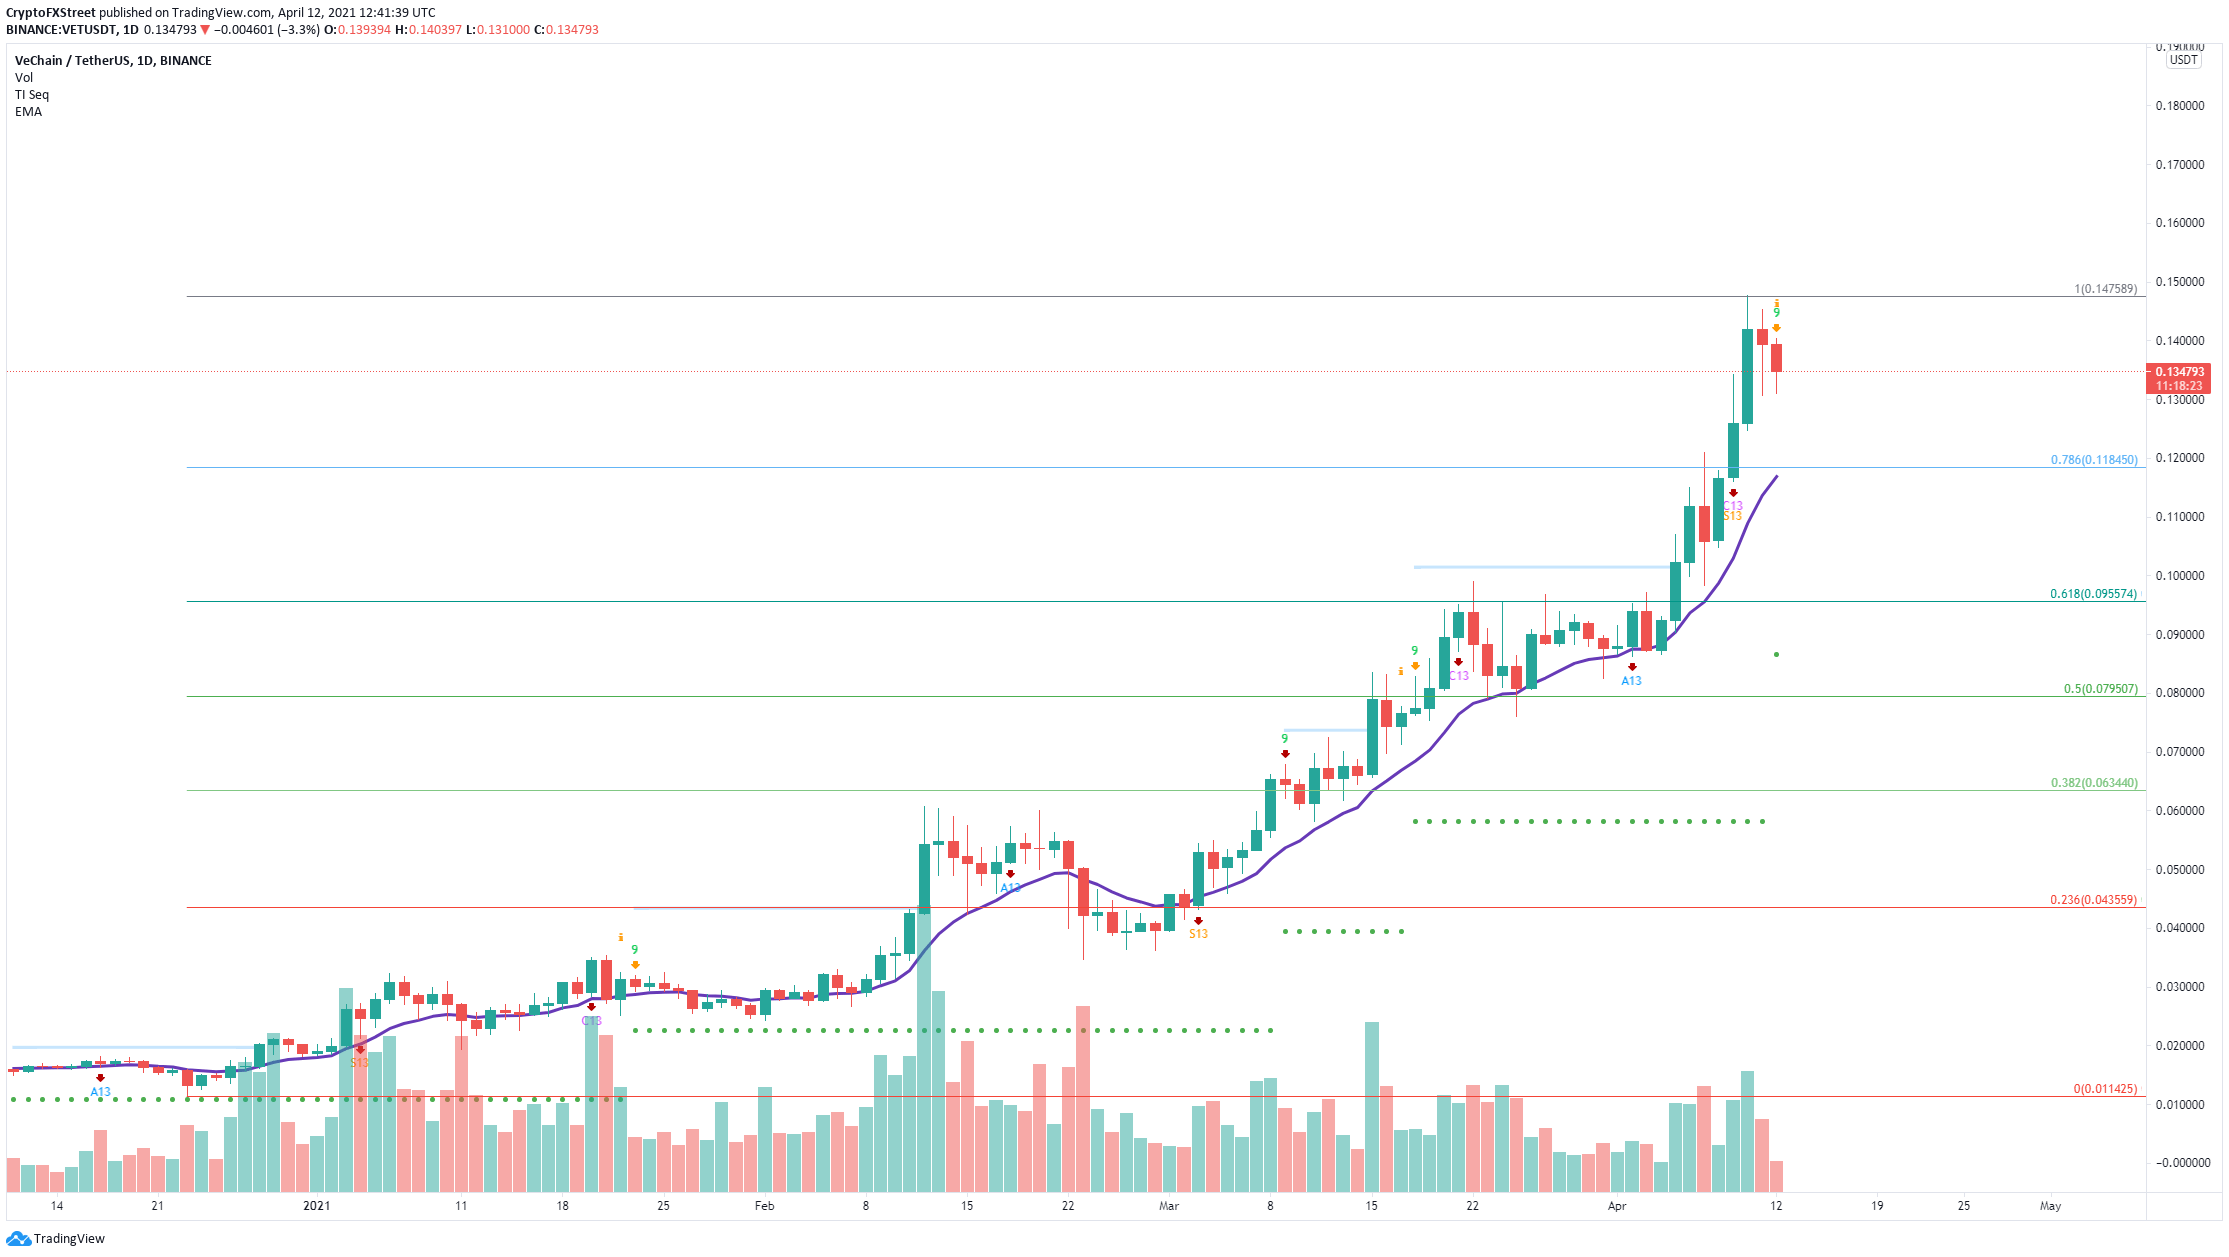
VET/USD daily chart with 12 EMA
The nearest support level and bearish price target is $0.118, which is the 78.6% Fibonacci retracement level. This level also coincides with the 12-day EMA, a strong support level that has buttressed VeChain price since March 2.
Losing this critical support point has the potential to drive VeChain price down toward the 61.8% Fibonacci retracement level at $0.095.
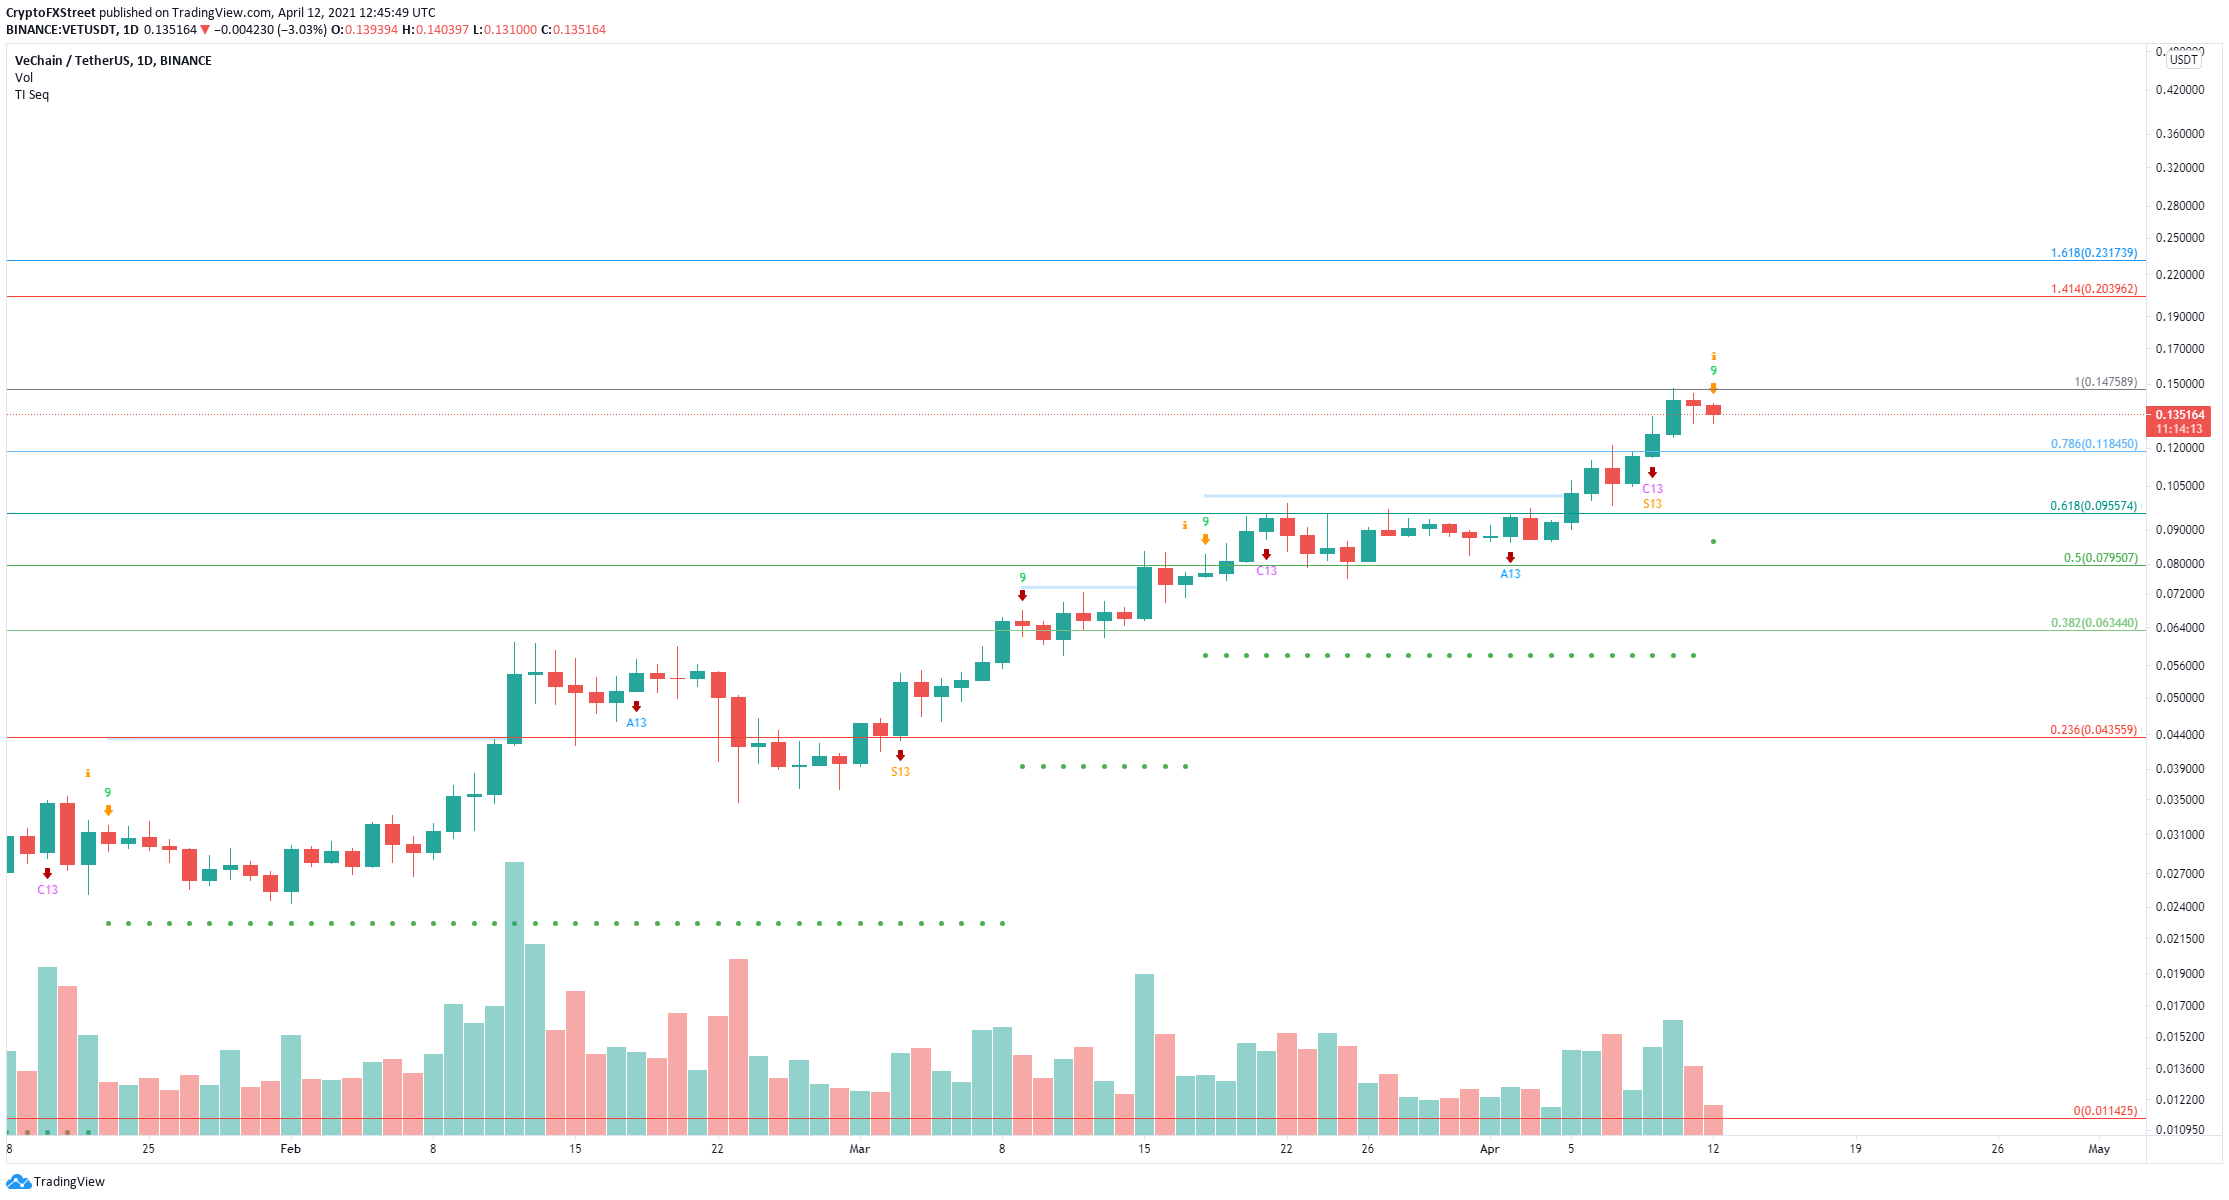
VET/USD daily chart
However, given the recent bullish momentum, there is still a chance for buyers to invalidate the sell signal. A breakout above the previous high of $0.1478 would be enough and can drive VeChain price toward $0.20 at the 141.4% Fibonacci level, as there is practically no resistance ahead.
Author

Lorenzo Stroe
Independent Analyst
Lorenzo is an experienced Technical Analyst and Content Writer who has been working in the cryptocurrency industry since 2012. He also has a passion for trading.


