Uniswap Price Prediction: UNI eying up a significant price move, shows indicators
- UNI is currently trading at $3.49 after recovering from its low of $2.47.
- The digital asset seems to be hitting a critical resistance level.

The release of UNI was one of the most successful ones, rapidly climbing towards a $700 million market capitalization and getting listed on all major exchanges like Binance, and others. The initial bull rally didn’t last long and after peaking at $8, UNI is now only trading at $3.29.
UNI is facing a critical resistance level ahead
Although UNI has managed to rebound from the low of $2.47, it is still facing an important resistance level established at $3.5 on the 12-hour chart and tested several times during the past week. Rejection from this level has the potential to take UNI down to $3 in the short-term.
UNI/USD 12-hour chart
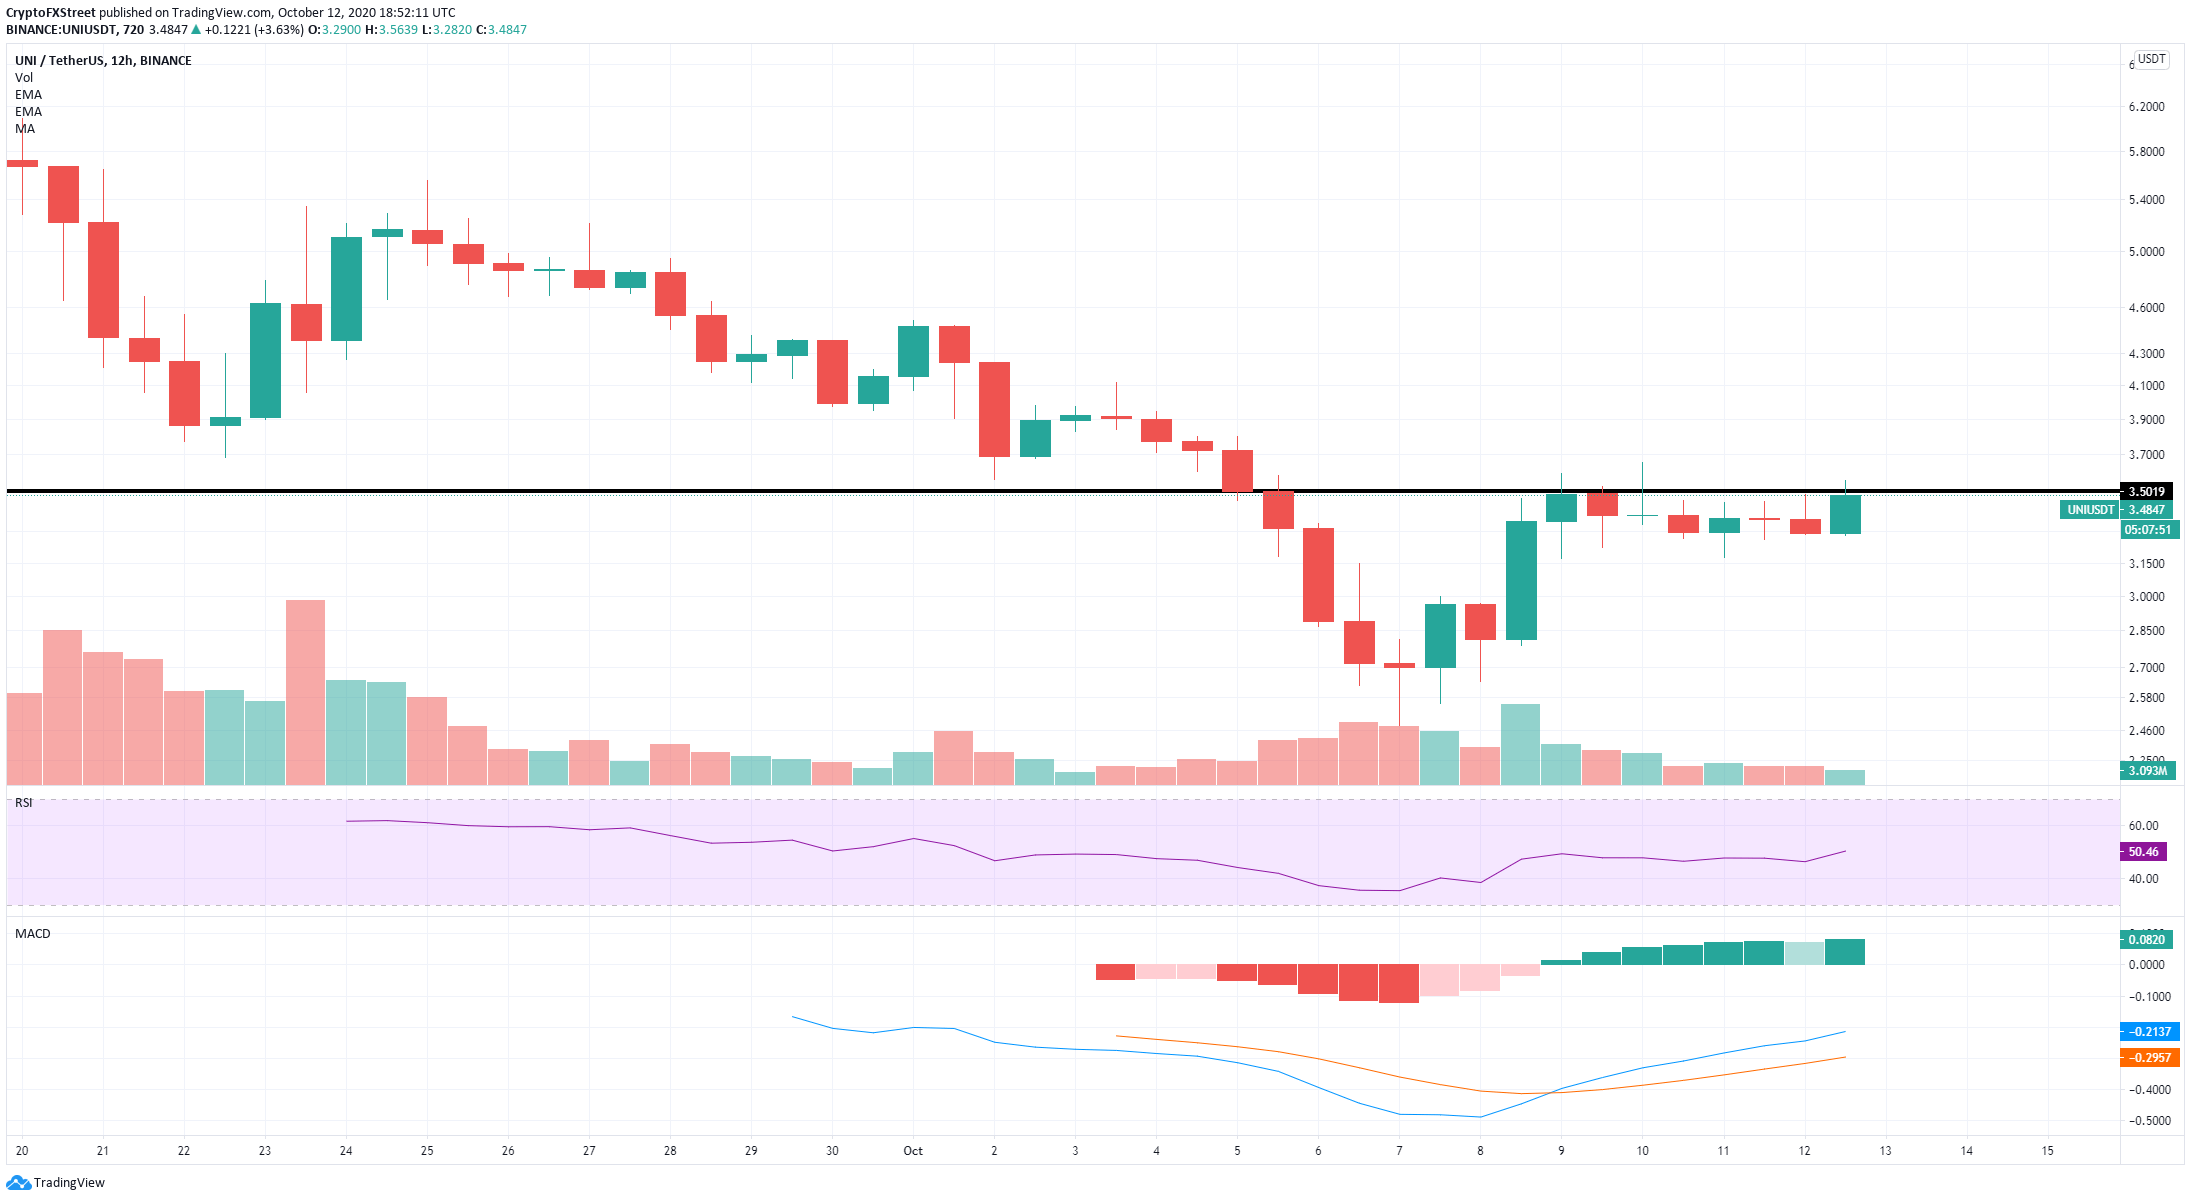
It’s important to note that the trading volume of UNI has been declining significantly over the past few days, usually an indicator of a major move underway. The last time the volume dropped so low was around September 30 right before Uniswap suffered a 44% decline.
UNI New Addresses Chart
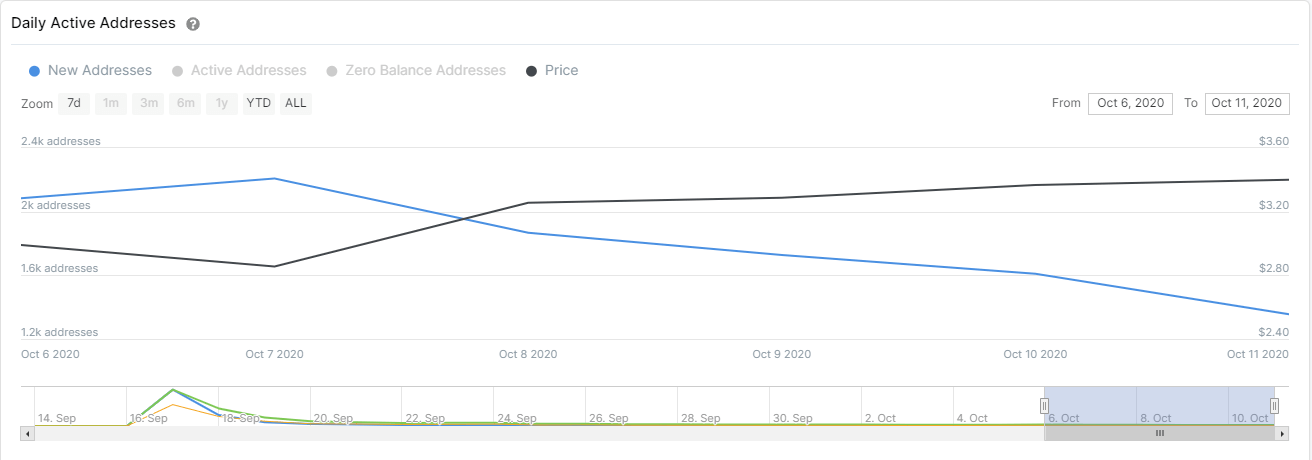
Additionally, the interest in the digital asset seems to be fading away, despite the recent bullish momentum. The chart with new addresses joining the UNI network provided by IntoTheBlock shows that this number has dropped from a high of 2,210 on October 7 to a current low of 1,360.
UNI/USD 4-hour chart
-637381261158694497.png)
The Bollinger Bands on the 4-hour chart are extremely tight, indicative of a major price move coming up. The positive note for the bulls here is the defense of the 50-SMA, turning the moving average into a support level. A breakout above the resistance level at $3.5 on the 12-hour chart and the upper Bollinger Band can push UNI towards the 100-SMA at $3.77 and eventually the psychological level at $4.
UNI IOMAP Chart
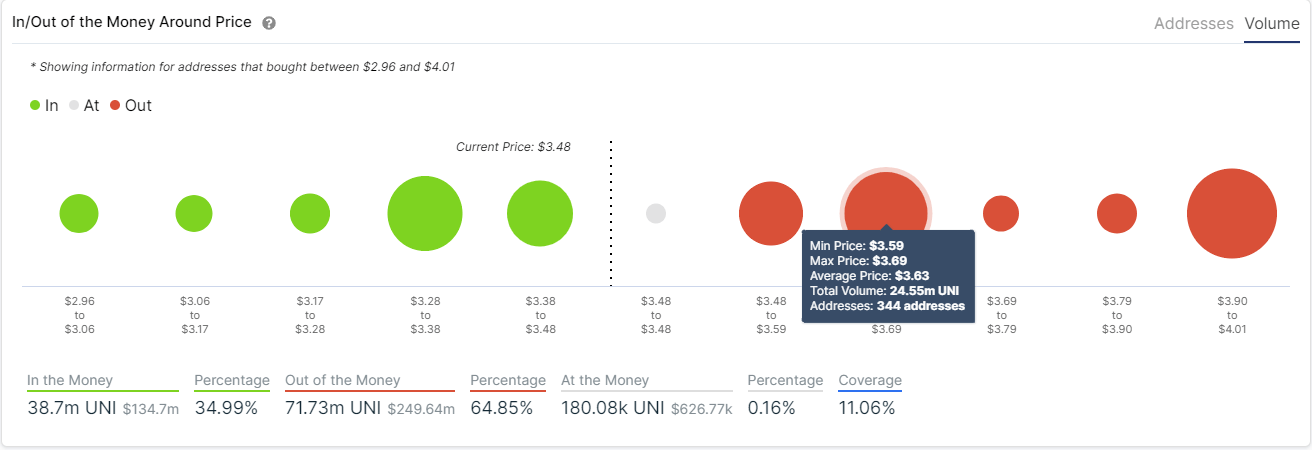
The In/Out of the Money Around Price chart by IntoTheBlock shows something quite similar. The range between $3.59 and $3.69 poses the highest threat for the bulls with 24.5 million in volume. However, after this area, the next resistance point is located all the way up at $3.9-4.
Crucial levels to watch out for
After a massive start, UNI started to decline and experienced a massive correction period. The digital asset has rebounded from the low at $2.47 but is facing steep resistance ahead. The rejection from a crucial resistance level at $3.5 can push Uniswap towards $3.
On the other hand, bulls can continue with the uptrend if they can manage to push the price of UNI above the resistance level at $3.5 and the upper Bollinger Band on the 4-hour chart. A bullish breakout above both levels will make the price rise towards $3.77 and potentially $4.
Author

Lorenzo Stroe
Independent Analyst
Lorenzo is an experienced Technical Analyst and Content Writer who has been working in the cryptocurrency industry since 2012. He also has a passion for trading.



