UniSwap Technical Analysis: UNI on the cusp of a major reversal
- UniSwap rally from the primary support at $2.5 rejected at $3.5.
- The 50 SMA in the 4-hour range limits upward price action in conjunction with the descending parallel channel resistance.

UniSwap has lost over 60% of its value since its all-time high of $8.6. The token received immense support after the launch in September but failed to sustain the uptrend, mainly due to decreasing liquidity. Nonetheless, the extended breakdown recently approached a bottom around $2.5, as reported. A reversal ensued from this level, with the price making a remarkable upswing. At the time of writing, UNI is trading at $3.24, following a rejection at $3.5.
UniSwap resumes the downtrend
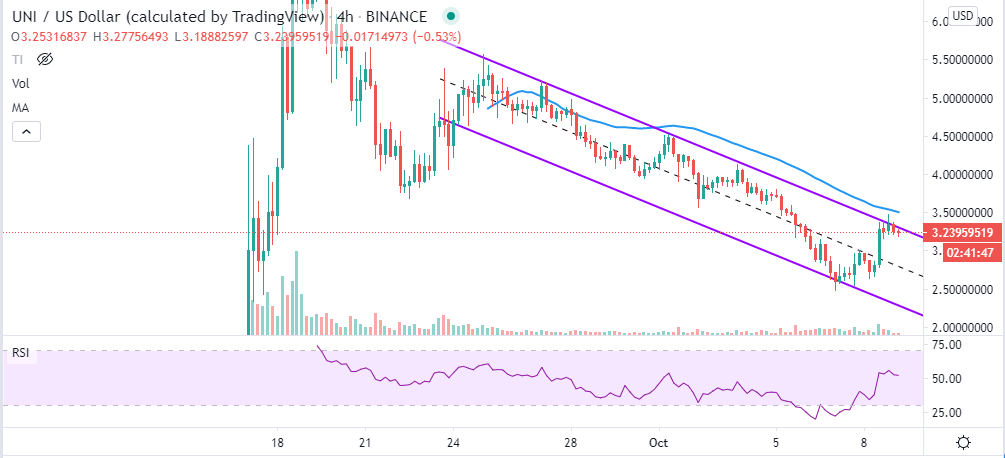
Some people might argue that UNI's downtrend never hit bottom because the token is still trading within a descending parallel channel. However, it is essential to consider a 16% surge over the last 24 hours. The reversal from the channel support broke above the middle boundary before hitting pause at the upper trendline. UNI/USD was also rejected by the 50 Simple Moving Average (SMA) in the 4-hour timeframe.
The Relative Strength Index (RSI) brings to light a developing bearish momentum following the rejection at $3.50. To avert the potential losses, buyers must pull the price above the channel's upper boundary resistance as well as the 50 SMA.
UNI/USD 4-hour chart
IntoTheBlock's IOMAP model reveals intensifying selling pressure towards $3.5. The most significant hurdle runs from $3.4 to $3.5. Previously, nearly 22,400 addresses bought roughly 15.4 million UNI in this range. Although the short term resistance at $3.3 might be brought down, most buying pressure will be absorbed, sabotaging the bulls' efforts.
UniSwap IOMAP chart
-637378183348789980.png)
On the downside, the lack of a robust support area suggests that a reversal could erase most of the progress made in the last 24 hours. Meanwhile, some of the selling pressure could be absorbed in the range between $3.01 and $3.09. Here, 116 addresses previously bought roughly 8.3 million UNI.
The "Daily New Addresses" metric shows a slight increase in the number of new addresses joining the network. A downtrend recorded from the beginning of October bottomed out at roughly 2,100 addresses, giving way for a spike to approximately 3,300 addresses on October 8. The new addresses' continued growth is a bullish signal for the network and UniSwap's value.
UNI new addresses chart
-637378217667934371.png)
Looking at the other side of the picture
It is worth mentioning UNI has drawn investors' attention following the bounce from $2.5. If the token uptake rises based on the increasing number of new addresses joining the network, then the uptrend could receive a fresh boost. Price action above the descending parallel channel and the 50 SMA will most likely pave the way for gains beyond $4, invalidating the expected reversal.
Author

John Isige
FXStreet
John Isige is a seasoned cryptocurrency journalist and markets analyst committed to delivering high-quality, actionable insights tailored to traders, investors, and crypto enthusiasts. He enjoys deep dives into emerging Web3 tren


