|

Uniswap Price Forecast: UNI aims for V-shaped recovery towards $33

  • Uniswap price defended a key support level at $19.
  • The digital asset aims for a strong rebound towards its previous all-time high of $32.99.
  • A crucial indicator has presented a buy signal on the 6-hour chart.

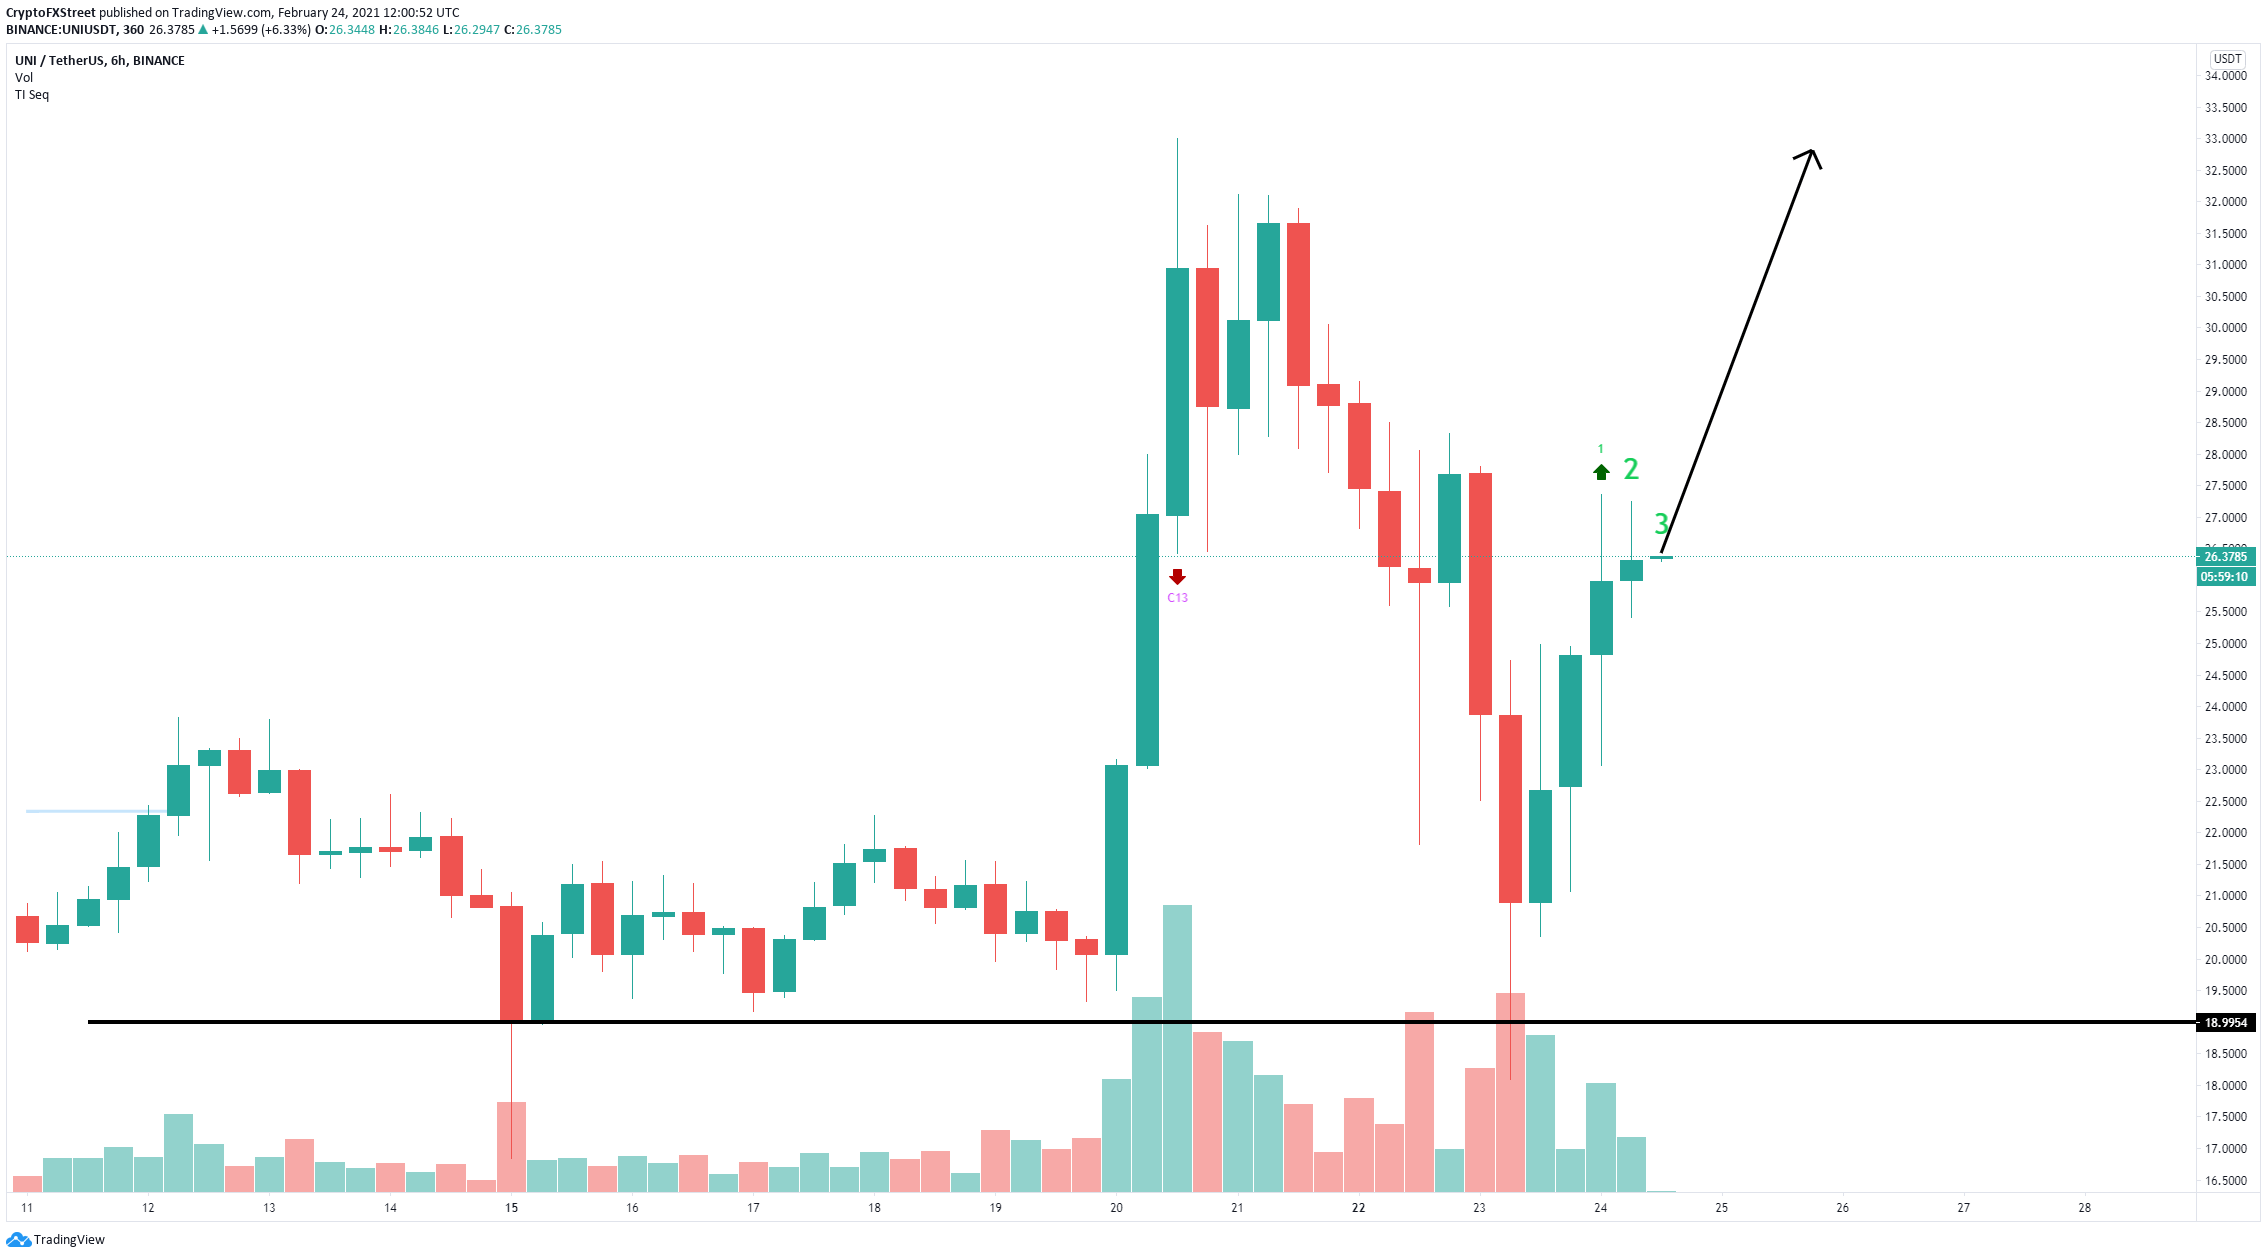
Uniswap price suffered a major 45% pullback in the past three days, dropping to a low of $18.1 from its all-time high of $32.99. The digital asset has defended a crucial support level and aims for a notable rebound.

Uniswap price can quickly jump to $32.99 

Uniswap has experienced a significant rebound from the critical support level at $19, climbing by more than 55% in the past 24 hours. On the 6-hour chart, the TD Sequential indicator has presented a buy signal which hasn't seen continuation just yet.
uni price

UNI/USD 6-hour chart

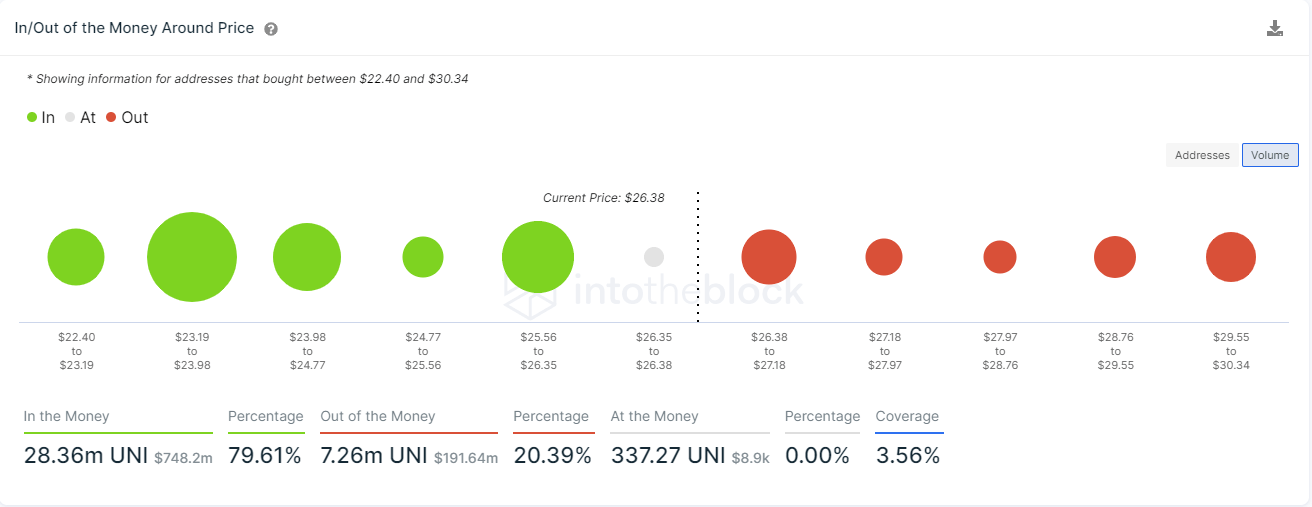
The In/Out of the Money Around Price (IOMAP) chart indicates that UNI bulls face very little resistance to the upside. The most significant barrier is located between $26.38 and $27.18, with a total volume of 3 million UNI tokens from 2,360 addresses. A breakout above this point should easily drive Uniswap price towards $33.
uni price

UNI IOMAP chart

On the other hand, the number of whales holding between 1,000,000 and 10,000,000 tokens has significantly decreased from 66 on February 13 to 61 currently, indicating that large holders have sold, a bearish development. 

uni price

UNI Holders Distribution

The IOMAP model indicates that the nearest support area is between $25.5 and $26.3. Losing this significant range could push Uniswap price down to the next cushion at $23. 

Author

Lorenzo Stroe

Lorenzo Stroe

Independent Analyst

Lorenzo is an experienced Technical Analyst and Content Writer who has been working in the cryptocurrency industry since 2012. He also has a passion for trading.


More from Lorenzo Stroe
Share:

Editor's Picks

Uniswap Price Forecast: UNI tests 200-day EMA supply amid renewed retail demand
Uniswap (UNI) edges higher near an immediate resistance at $3.88 on Tuesday. The native decentralized exchange (DEX) token is defying a broader correction in the cryptocurrency market, even as Bitcoin (BTC) falls toward $63,000 from its July highs around $67,000.
XRP slides amid risk-averse pressure and ahead of Fed rate decision
Ripple (XRP) continues to trade under increasing pressure on Tuesday. This marks the second consecutive day of declines, reflecting broader risk-off sentiment as investors appear to shift gears in anticipation of the Federal Reserve (Fed) interest rate decision. On Wednesday, the Federal Open Market Committee (FOMC) is widely expected to leave interest rates unchanged in the 3.50%-3.75% range.
Crypto Today: Bitcoin, Ethereum, XRP remain under pressure as risk-off sentiment persists
Bitcoin (BTC) is falling toward the immediate $63,000 support at the time of writing on Tuesday, weighed down by continued risk-off sentiment. Altcoins, including Ethereum (ETH) and Ripple (XRP), remain under pressure, trading below $1,900 and $1.10, respectively. Crypto market sentiment remains largely unresponsive and in the Fear territory, as reflected in the Fear & Greed Index.
Bitcoin price prediction: Is $60K back in focus as headwinds mount?
Bitcoin is falling towards 63k, at a 10-day low, as a sell-off in AI-linked stocks has hit risk sentiment, spilling over into cryptocurrencies and as investors look cautiously ahead to tomorrow's FOMC rate decision. Bitcoin is down 2.7% over the past 24 hours and more than 4% over the past seven days as it extends its pullback from 67k the July high reached last week.
Bitcoin: BTC holds firm, but the $100 Oil threat could change the game
Bitcoin (BTC) is modestly recovering, trading at $65,400 on Friday and holding firmly above the key support zone. US-listed spot Bitcoin Exchange Traded Funds (ETFs) supported BTC’s modest recovery as they continued to attract institutional inflows through Thursday, pointing to the third consecutive week of inflows.

