|

Uniswap Price Forecast: Technical outlook suggests a bullish breakout ahead

  • Uniswap price faces resistance around $8.26; a firm close above suggests a rally ahead.
  • The MACD indicator flips into the positive territory amid a bullish crossover.
  • A daily candlestick close below $7.08 would invalidate the bullish thesis.

Uniswap (UNI) is trading slightly below $8 on Thursday after rejecting a key resistance level on Wednesday. A successful close above this threshold could indicate a rally for the decentralized exchange, bolstered by technical indicators showing a bullish crossover pointing to potential upward momentum.

Uniswap could have double-digit gains if it closes above the key resistance level

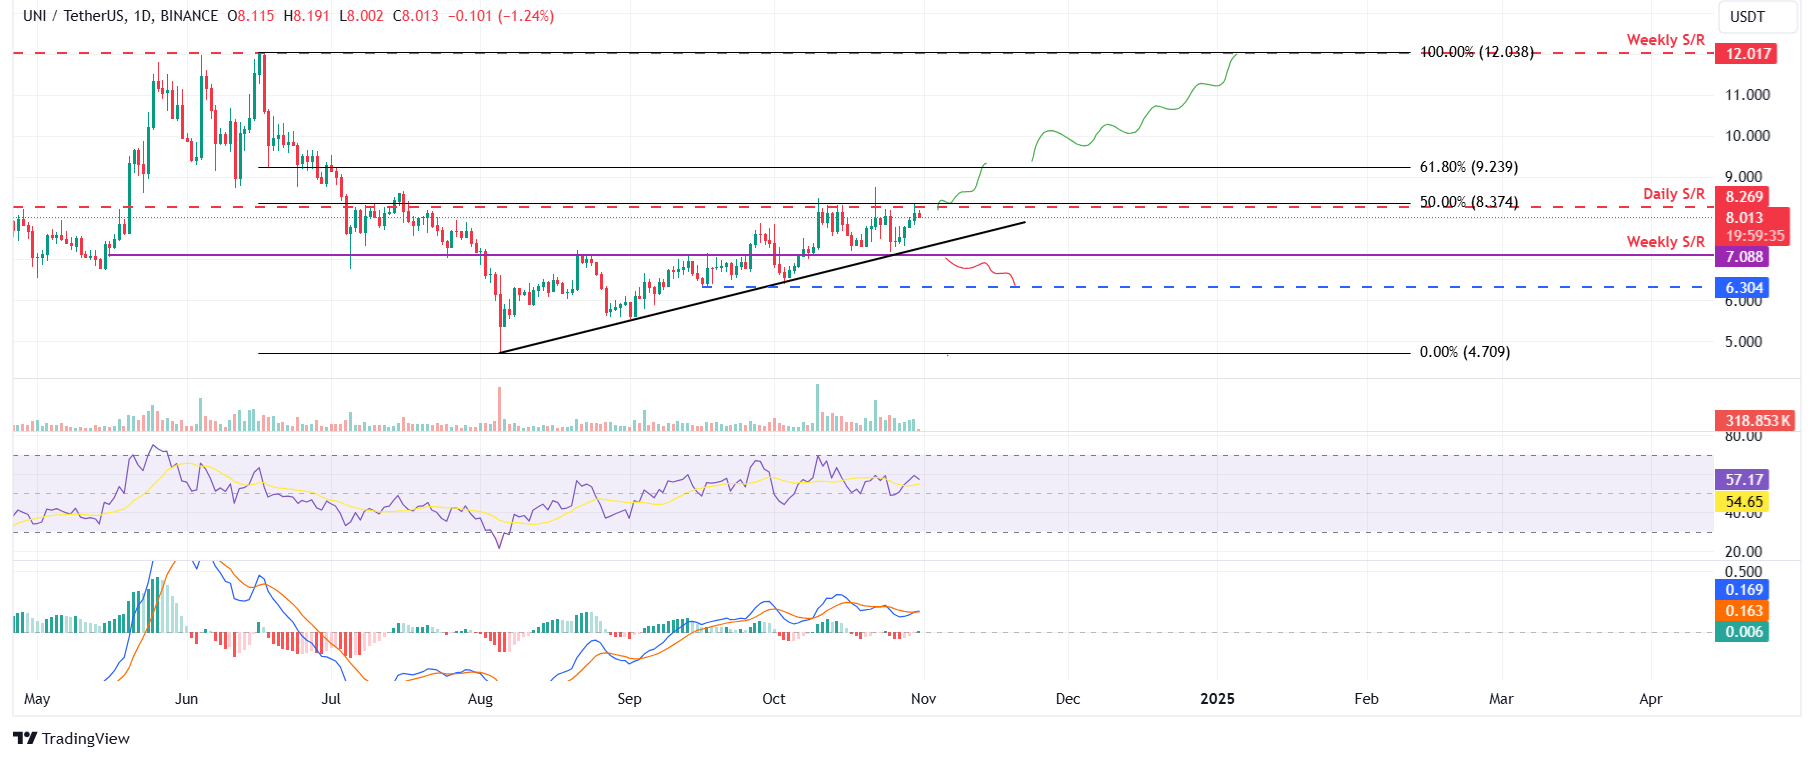
Uniswap has struggled to break through the daily resistance level around $8.26, which roughly coincides with the 50% price retracement at $8.37. It was again rejected on Wednesday. At the time of writing on Thursday, it trades slightly down around $8.01.

If UNI breaks above the daily resistance and closes above $8.37, it could rally 10% to retest its 61.8% Fibonacci retracement level at $9.23. A successful close above this level could extend the rally by 30% to retest its next weekly resistance at $12.01.

The Relative Strength Index (RSI) on the daily chart reads at 57, above its neutral level of 50, suggesting that bullish momentum is gaining traction. Moreover, the Moving Average Convergence Divergence (MACD) indicator is also flipping a bullish crossover on the daily chart, indicating an upward momentum on the horizon.
UNI/USDT daily chart

UNI/USDT daily chart

The bullish thesis would be invalidated if UNI fails to break above the daily resistance level and declines to close below the weekly support of $7.08. This scenario would extend the decline to retest the September 16 low of $6.30.

Author

Manish Chhetri

Manish Chhetri is a crypto specialist with over four years of experience in the cryptocurrency industry.


More from Manish Chhetri
Share:

Editor's Picks

XRP approaches key support as risk-off sentiment deepens
Ripple (XRP) is trading at $1.06 on Monday, maintaining its position within a broader bearish trend. The token’s technical outlook continues to deteriorate, pressured by declining retail participation. Appetite for risk assets remains lethargic, as reflected in the Fear & Greed Index, which is embedded in the Fear territory at 28.
Crypto Today: Bitcoin, Ethereum, XRP extend decline amid renewed risk-averse sentiment
The cryptocurrency market remains weak on Monday, with Bitcoin (BTC) falling toward the nearest $62,000. Ethereum (ETH) and Ripple (XRP) reflect the sell-off across altcoins, edging lower toward $1,800 and $1.05, respectively. Risk appetite remains subdued, as the Fear & Greed Index holds steady at 28, deep within Fear territory.
The Bitcoin futures yield collapse: Once over 20%, now less than Treasury notes
Once a goldmine for carry traders, Bitcoin futures have flipped, consistently underperforming plain‑vanilla U.S. Treasuries every month since February. Carry trades consistently yielded 20% or more across regulated and unregulated crypto exchanges during the 2021 bull market. The strategy involved shorting Bitcoin futures while simultaneously buying a spot exchange-traded fund (ETF).
The crypto market is moving in the opposite direction to equities
The crypto market’s market capitalisation has fallen by 1% over the past 24 hours, returning to levels last seen in mid-July. The positive momentum the market showed in the first half of last week failed to take hold. Once again, we are seeing a negative correlation with the Nasdaq 100 index, this time in the form of falling cryptocurrencies while shares rise. Could this be becoming the new norm?
Bitcoin: Bulls hold the line
Bitcoin (BTC) edges slightly lower, trading at $64,300 at the time of writing on Friday but holding firmly above a key support zone. US-listed spot Bitcoin Exchange Traded Funds (ETFs) support BTC as they continued to attract institutional flows through Thursday, pointing to the fourth consecutive week of net inflows.

