Top 3 Price Prediction Bitcoin, Ripple, Ethereum: Strong bearish potential essential for continued rising
- Bitcoin resists falling and holds onto the price zone.
- Ethereum and Ripple move down and lose momentum.
- The current scenario can extend over several weeks.

The daily coverage is restarting after several days of absence, yet the technical situation is practically identical. After the unsuccessful attempt at a bullish break at the end of May, the top three cryptocurrencies remain at price levels close to the ceiling but with a few changes in their positioning.
The main characteristic of the current market is the compression situation seen in the ETH/BTC cross – the pair that I consider as an indicator of market background moves – has been in a narrow range since the first half of May.
ETH/BTC 4 Hours Chart
Technically, the situation is typical – since after crossing up on the main moving averages, they now follow the cross and form a strong confluence that keeps the price trap.
The positive note is that for the moment, the 0.030 support line has been respected, after the last attempt to drill through it during the Asian session.
Above the current price, the first resistance level is at 0.031 (SMA100 and EMA50), then the second resistance level is at 0.0317 (price congestion resistance and upper parallel trendline). The third resistance level for ETH/BTC is at 0.0335 (price congestion resistance and upper parallel trendline).
Below the current price, the first support level is at 0.0304 (SMA200 and price congestion support), then the second support level is at 0.0291 (price congestion support). The third support level for the ETH/BTC pair is at 0.0275 (price congestion support).
-636957546298143850.png)
The MACD on the 4-hour chart enters a negative zone after the first-hour bearish attempt. The move pulls the indicator out of the sluggishness of the past few days. The current structure is valid for both a bearish acceleration and an upward turn with increased volatility.
The DMI on the 4-hour chart shows bears dominating the market as bulls react to the 0.030 level attack with strong buys. The most likely scenario in the short term is a lateral bearish one.
BTC/USD Daily Chart
The BTC/USD is currently trading at the $7,749 price level after a new attempt to break the long-term bearish channel ceiling on June 7.
Above the current price, the first resistance level is at $7,870 (price congestion resistance), then the second resistance level is at $8,025 (price congestion resistance). The third resistance level for the BTC/USD pair is at $8,175 (price congestion resistance and long term down channel trendline ceiling).
Below the current price, the first support level is $7,600 (price congestion support), then the second support level is $7,400 (price congestion support). The third level of support for BTC/USD is $7,150 (price congestion support and EMA50).
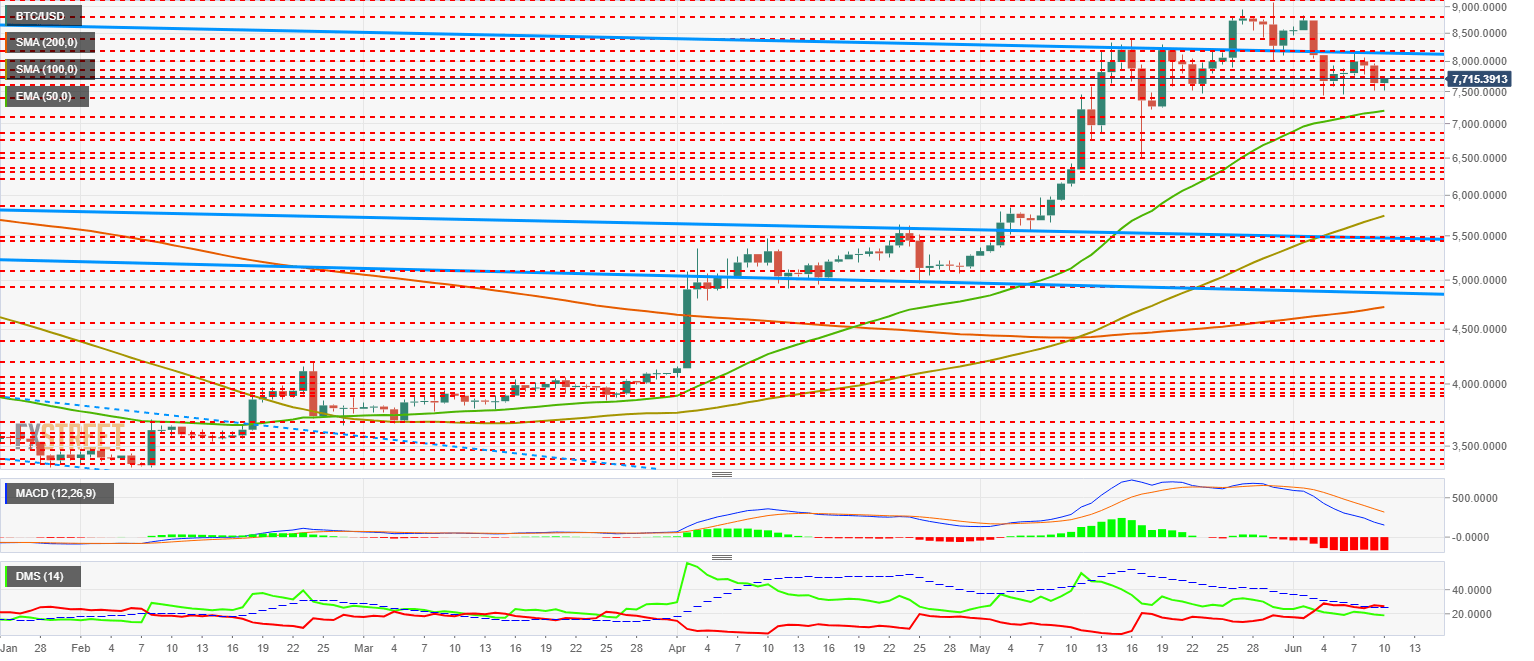
The MACD on the daily chart shows a bearish profile with plenty of travel ahead. The odds of a bullish cross are very low with the current configuration.
The DMI on the daily chart shows bears slightly outperforming the ADX line and initiating a pattern of bearish price development. The bulls do not give up yet and cling to the 20 levels in an attempt to keep the fight for control of the BTC/USD pair.
ETH/USD Daily Chart
ETH/USD is currently trading at $237.3 and recovers for a few cents the support level at $235 (price congestion support).
The first resistance level is at $250 (price congestion resistance), then the second resistance level is at $260 (price congestion resistance). The third resistance level for ETH/USD is at $290 (price congestion resistance).
Below the current price, the first support level is at $225 (price congestion support and EMA50), then the second support level is at $215 (price congestion support). The third level of support for the ETH/USD pair is at $205 (price congestion support).
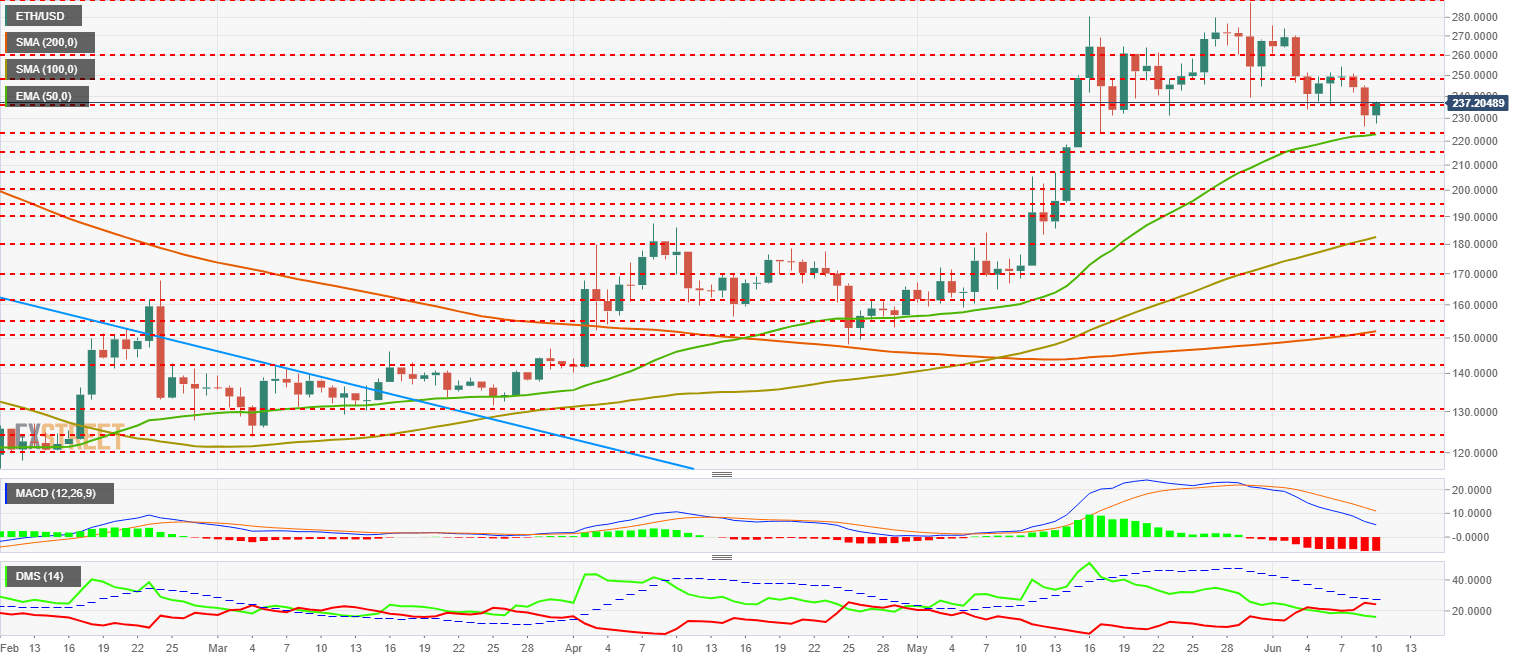
The MACD on the daily chart shows an active bearish profile. It is improbable that an upward movement will continue over time.
The DMI on the daily chart shows bears ahead of bulls. Both remain below the ADX line, which shows some weakness on both sides of the market.
XRP/USD Daily Chart
XRP/USD is currently trading at $0.39 from yesterday's low of $0.37 and is regaining the support of the EMA50.
Above the current price, the first resistance level is at $0.413 (price congestion resistance), then the second one is $0.43 (price congestion resistance). The third resistance level for XRP/USD is $0.44 (double price congestion resistance).
Below the current price, the first support level is $0.38 (EMA50), then the second support level is $0.037 (price congestion support). The third support level for XRP/USD is $0.345 (SMA100, SMA200, and price congestion support).
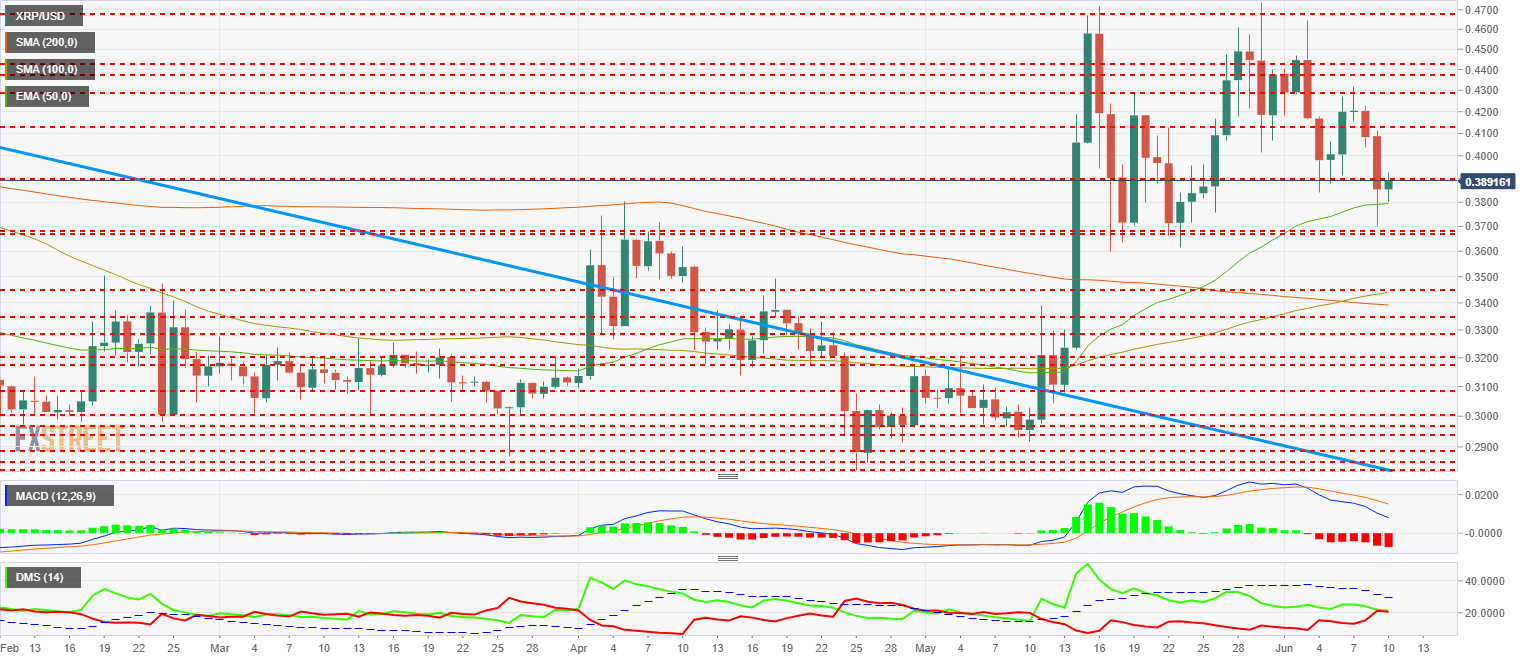
The MACD on the daily chart shows a strong bearish profile. The most likely scenario is a continuation of the bearish trend.
The DMI on the daily chart shows a tie between the bulls and the bears. Both sides of the market coincide at the 20 levels of the indicator and very far from the ADX line. The most likely future scenario – according to this configuration – is sideways or bearish sideways.
Get 24/7 Crypto updates in our social media channels: Give us a follow at @FXSCrypto and our FXStreet Crypto Trading Telegram channel
Author

Tomas Salles
FXStreet
Tomàs Sallés was born in Barcelona in 1972, he is a certified technical analyst after having completing specialized courses in Spain and Switzerland. He expanded his technical training following the guidance of great experts on the financial markets.


