Top 3 Price Prediction Bitcoin, Ripple, Ethereum: Bitcoin is over $9,200 - Maybe the Moon is too small for the King
- The potential shown by BTC/USD makes it difficult to put a limit on the rise.
- ETH/USD can fly higher than $290 with a target of $340.
- XRP/USD seeks to breach $0.47 looking for primary target at $0.55.

It's been full moon night in Europe as Bitcoin takes advantage of the good omen to soar to price levels unthinkable six months ago.
The BTC/USD pair managed to escape the long-term bearish channel and has only needed a few hours to start showing strength and setting a new relative high.
Now, in my opinion, the first condition for declaring the Crypto market fully bullish - BTC/USD above $8,150 - is fulfilled, but the second condition that requires Ethereum to do better than Bitcoin consistently is missing.
The ETH/BTC pair is of paramount importance in this market. There are two ways to accumulate Bitcoin, the first by buying it directly from the market. The second way is to balance the portfolio towards the Altcoins and especially towards the Ethereum.
Ethereum has a strong potential for revaluation against Bitcoin if we take as a reference to previous bull markets. In December 2017, the ETH/BTC pair reached 0.1520 (Bitcoins per Ethereum) and is currently at 0.0294. With this data, it is possible to assume a multiple of 5X. Do calculations on your portfolios.
ETH/BTC Daily Chart
The ETH/BTC pair is currently trading at 0.0294 after leaving the session low at 0.02913. The second support level is at 0.02759 (price congestion support), and the third one is at 0.02682.
Above the current price, the first resistance level is at 0.030 (price congestion resistance), then the second is formed by the confluence of the three moving averages between 0.0305 and 0.0312 (EMA50, SMA100, and SMA200). The third resistance level extends from 0.0319 to 0.0322 (price congestion resistance and parallel upper bullish trendline).
-636963612079252346.png)
The MACD on the 4-hour chart shows a decelerating bearish profile structure. It is an open scenario, in which both a violent rise and bearish terminal movements can occur.
The DMI on the 4-hour chart provides more information. The bears move above the ADX line, and this indicates continuity in the current trend. The bulls for their part go to levels not seen since mid-May.
BTC/USD Daily Chart
Bitcoin is quoted at $9,175 and exceeds the resistance by $9,160 (price congestion resistance) at the time of writing.
Above the current price, the next resistance level is at $9,600 (price congestion resistance), then the second resistance level is at $10,550 (price congestion resistance) and the third one at $11,300 (price congestion resistance).
Below the current price, the first level of support is at $8,820 (price congestion support), then the second at $8,450 (price congestion support). The third level of support for the BTC/USD pair is at $8,150, the confluence level of price congestion support and the trend line that serves as the roof of the long term downstream channel.
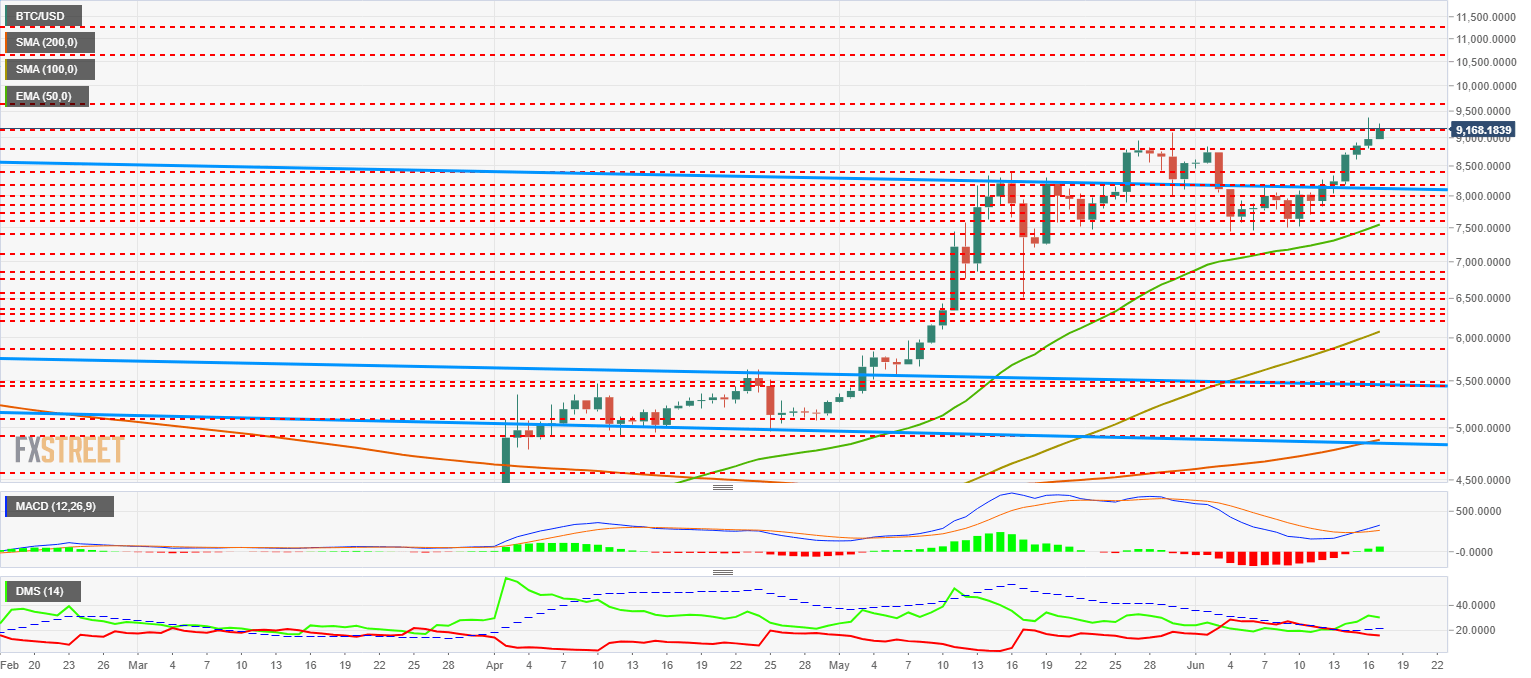
The MACD on the daily chart shows a precise bullish cross with all the room ahead to develop. It is a very optimistic structure.
The DMI on the daily chart shows how the bulls move fast to the upside and exceed the ADX line, a sign of bullish continuity. The bears, on the other hand, resist quite well although they lose the level 20 of the indicator.
ETH/USD Daily Chart
The ETH/USD is trading at $272, still 10% below the $290 relative high of last May 29. It is a level that becomes crucial and will be essential to watch in the coming hours.
Above the current price, the first resistance level is at $290 (price congestion resistance and relative maximum, then the second resistance level is at $306 (price congestion resistance). The third one level is at $320 (price congestion resistance).
Below the current price, the first level of support for the ETH/USD pair is at $260 (price congestion support), then the second level of support is at $250 (price congestion support) and the third level of support is at $238, with the confluence of the EMA50 and a new price congestion support).
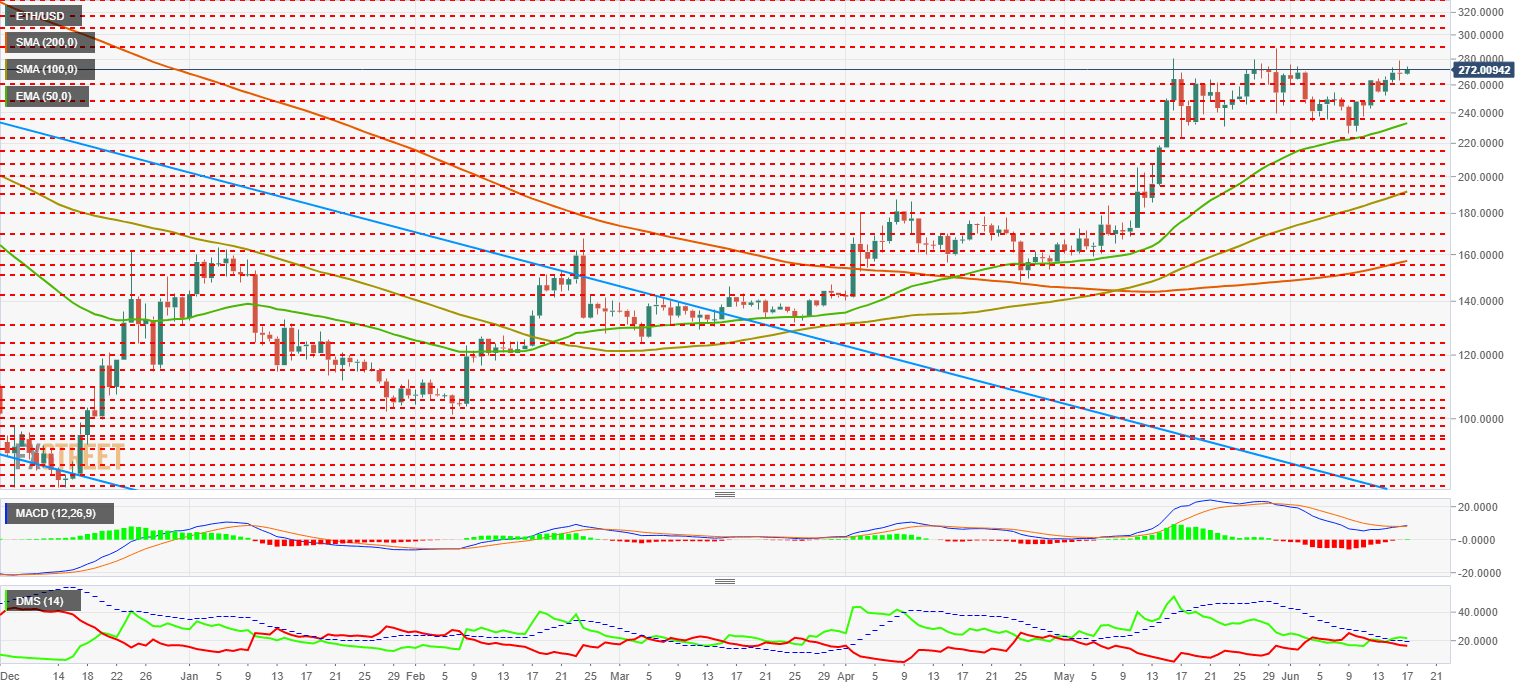
The MACD on the daily chart shows a bullish cross in development. The cross profile is fragile and may show resistance in the next few hours.
The DMI on the daily chart shows how the bulls are above level 20 and passing the ADX line. As in the case of the MACD, the structure is fragile but if it consolidates, it would be very bullish. Bears decrease in trend strength but are not at extreme levels yet.
XRP/USD Daily Chart
The XRP/USD is currently trading at the $0.435 price level. XRP is in a dense resistor zone and needs to exceed $0.468 to enter clean terrain.
Above the current price, the first resistance level is $0.438 (price congestion resistance), then the second resistance level is $0.444. The third resistance level for the XRP/USD pair is $0.468 (price congestion resistance and relative maximum).
Below the current price, the first support level is $0.43 (price congestion support), then the second support level is $0.412 (price congestion support) and the third one is $0.39, a confluence level between the EMA50 and a price congestion support.
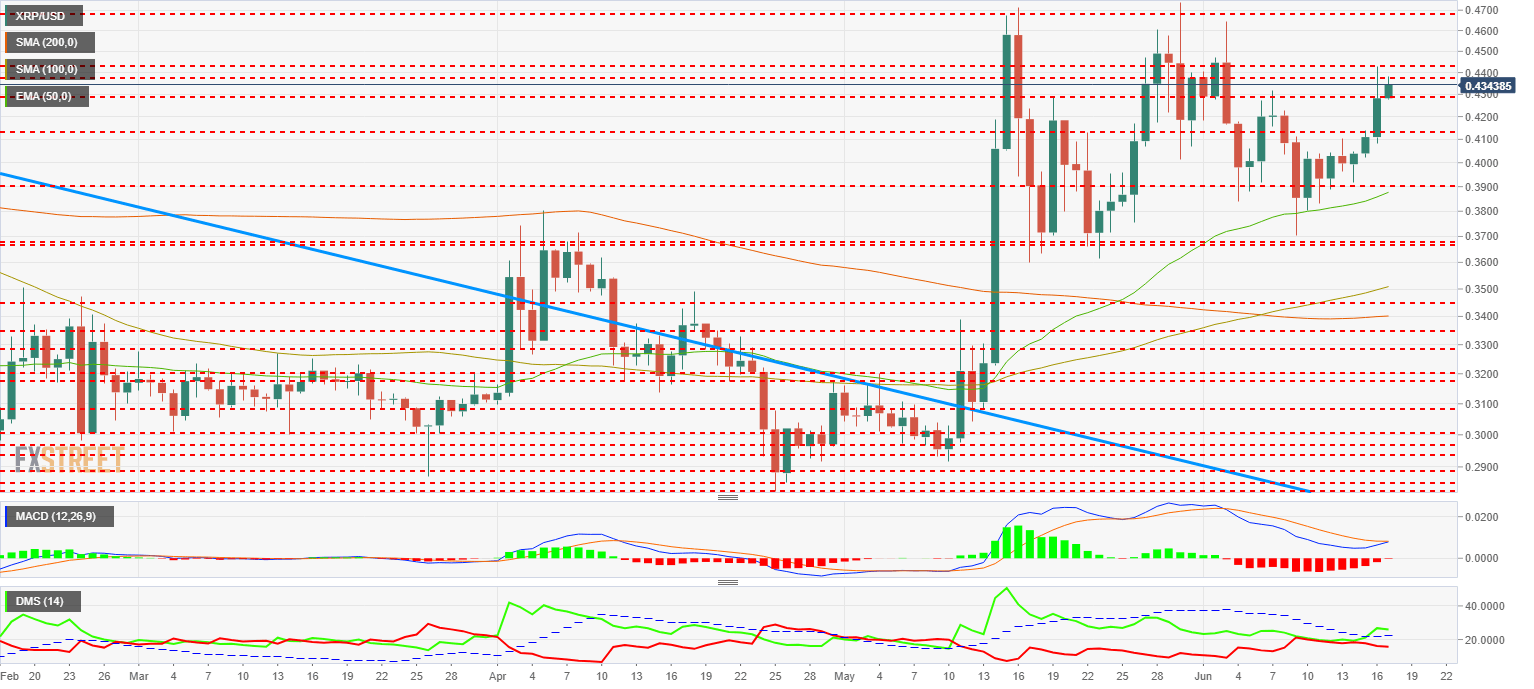
The MACD on the daily chart shows a possible bullish cut in the next few days, so we cannot rule out a contrarian move in the next few hours.
The DMI on the daily chart shows the bulls taking control and easily beating the ADX line. The structure is very bullish. The bears move below level 20 and are still far from extreme levels.
Get 24/7 Crypto updates in our social media channels: Give us a follow at @FXSCrypto and our FXStreet Crypto Trading Telegram channel
Author

Tomas Salles
FXStreet
Tomàs Sallés was born in Barcelona in 1972, he is a certified technical analyst after having completing specialized courses in Spain and Switzerland. He expanded his technical training following the guidance of great experts on the financial markets.


