Top 3 Price Prediction Bitcoin, Ripple, Ethereum: Bitcoin dominance leads market to total collapse
- The Bitcoin dominance graph shows levels unseen in years.
- Some details provide hope for a possible positive escape from the current moment.
- If XRP were listed on Wall Street, it'd be going up.

The Crypto market reaches the end of the week stuck in the process of technical consolidation. The $12,000 level currently appears as a mighty challenge for Bitcoin as it continues to increase its market dominance.
The king of cryptos currently accounts for 70.3% of the total market value – an extremely high level.
The Bitcoin Dominance chart in the weekly range has reached the SMA200 right now. It is going to be a litmus test for the health of the market as a whole.
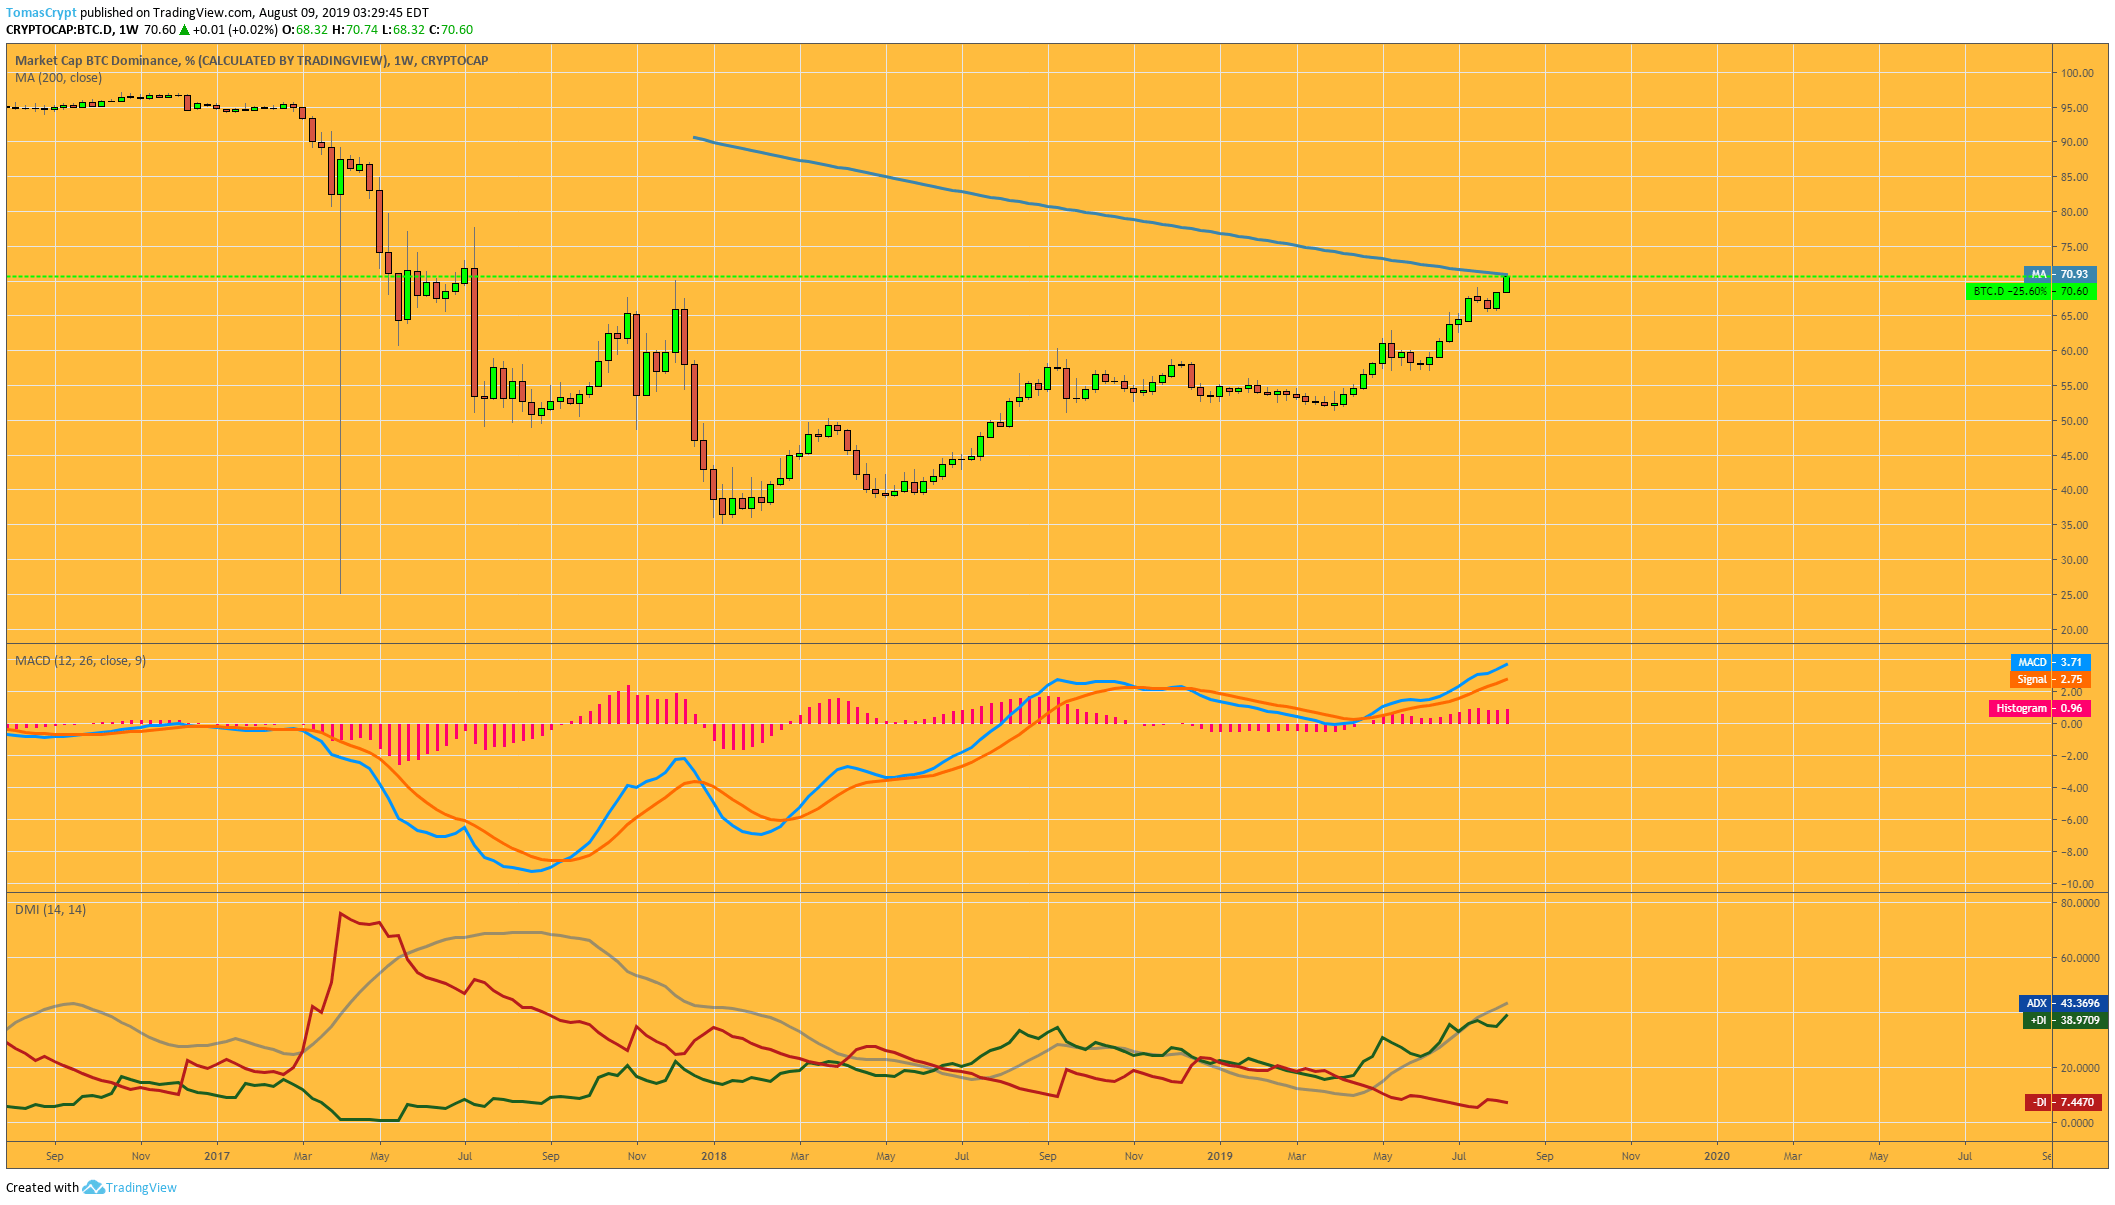
The MACD indicator in this weekly chart shows good health. But, the weekly DMI in the weekly range makes it clear that Bitcoin's best moments have passed, and moves below the ADX line – for the first time since June 2018.
If Bitcoin can surpass this average as it easily did in the daily chart, the Altcoin market can significantly suffer. In this case, we could see a severe cleansing of the Alt market.
We will see the answer to this critical technical moment in the coming weeks.
ETH/BTC Daily Chart
The ETH/BTC cross faithfully reflects Bitcoin's dominance over other digital assets.
ETH/BTC is currently trading at 0.01792 and is losing some speed compared to previous days. Today we count 11 consecutive days of declines – something that had never happened before. Even in December 2017, in the days before the last bump, pair had only suffered seven straight days of falls.
Below the current price, the first support level is at 0.017 (price congestion support), then the second at 0.015 (double price congestion support) and the third one at 0.013 (price congestion support).
Above the current price, the first resistance level is at 0.0187 (price congestion resistance), then the second at 0.020 (price congestion support) and the third one at 0.023 (double price congestion resistance).
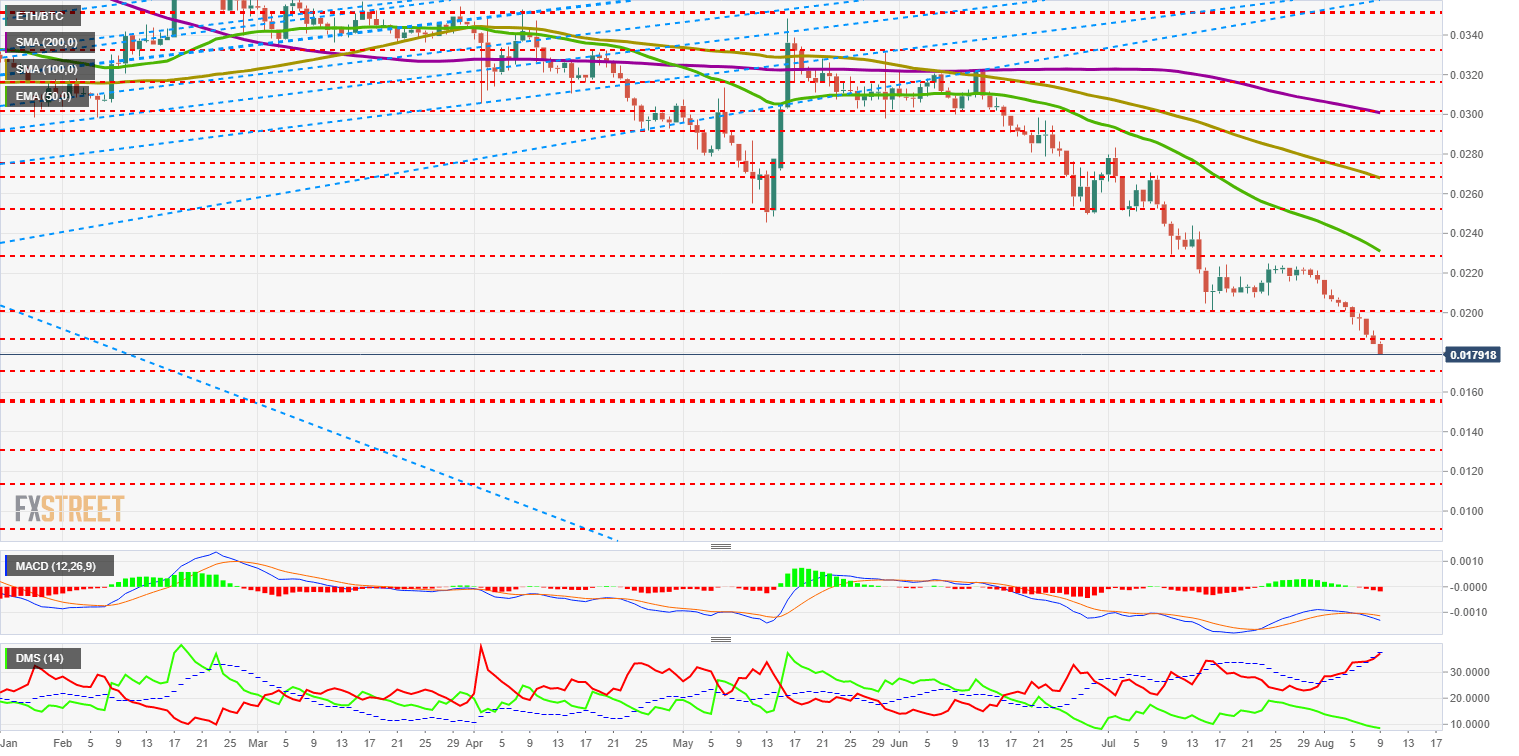
The MACD on the daily chart crosses downward and opens the door to lower levels. The pattern allows for a bullish cross if there is a sharp increase in volatility.
The DMI on the daily chart shows bulls at minimum levels and just above the levels that, when reached in the past, triggered a bullish signal. Bears are also at unparalleled levels.
This pair is in an extreme technical situation that may bring sharp jolts in the coming weeks.
BTC/USD Daily Chart
BTC/USD is trading at $11,722 as it continues to push hard against the price congestion resistance of $12,000.
Above the current price, the first resistance level is at $14,000 (relative highs), then the second at $17,000 (price congestion resistance) and the third one at historic highs of $19,890.
Below the current price, the first support level is at $11,325 (price congestion support), then the second at $10,700 (price congestion support and EMA50) and the third one at $9,630 (price congestion support and SMA100).
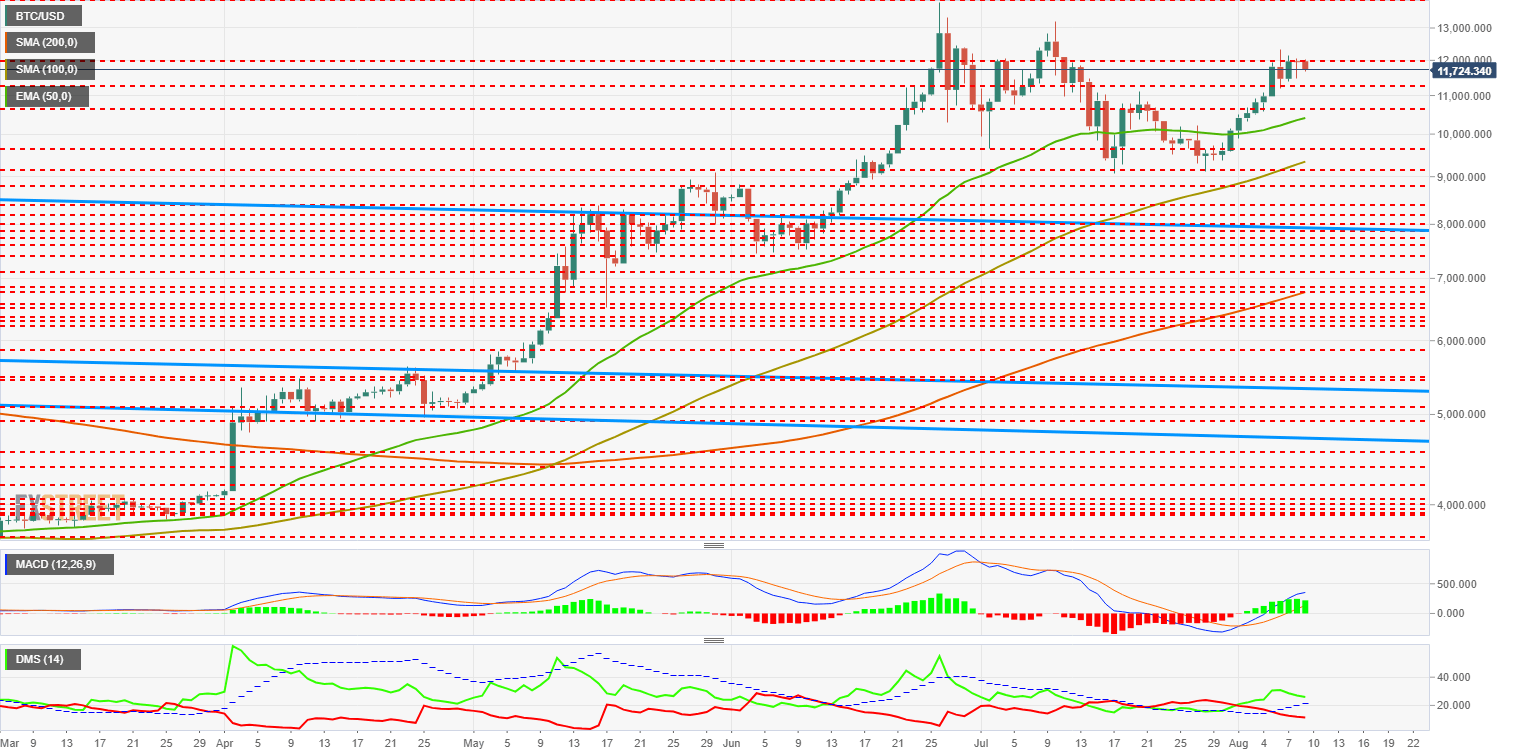
The MACD on the daily chart shows a very bullish profile. The lines are far apart while the bullish slope remains. There may be a correction that joins the lines, as the opening is extreme.
The DMI on the daily chart shows how the bulls lose strength and get ready to test the ADX line from above. The bears are not taken for granted and do not display any intention to increase their activity.
ETH/USD Daily Chart
ETH/USD trades at the $210.1 price level and seeks support at $215 (price congestion support). Moving averages begin to concentrate around $220. This type of moving averages meeting often causes increased volatility in the asset.
The first level of support – beyond $215 mentioned earlier – is at $208 (price congestion support), then the second at $200 (price congestion support) and the third one at $195 (price congestion support and SMA200).
Above the current price, the first resistance level is at $224 (price congestion resistance), then the second at $238 (price congestion resistance and EMA50) and the third one at $249 (price congestion resistance and SMA100).
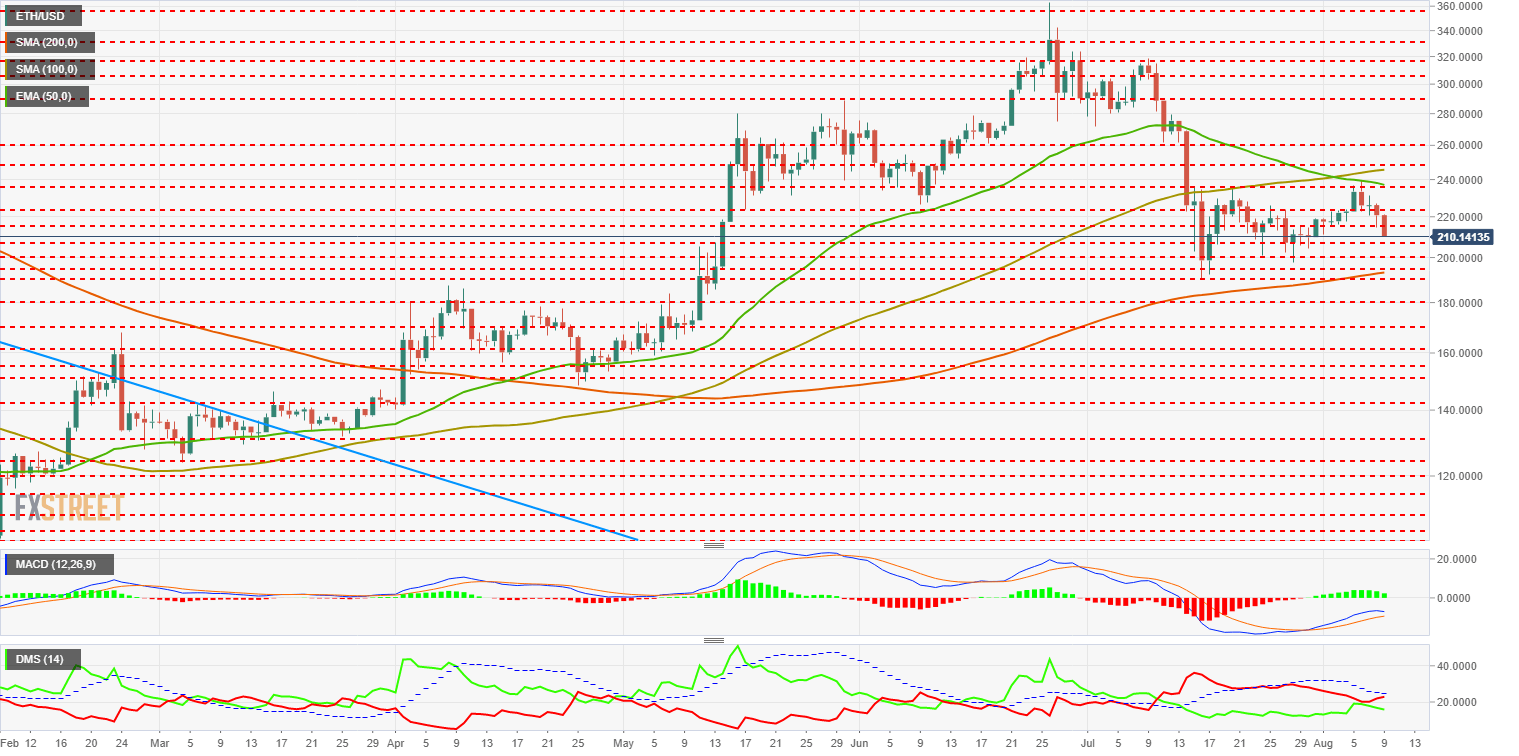
The MACD on the daily chart shows a loss of momentum that is approaching the lines. The profile flattens, so it is difficult for a bearish cross to occur and the most likely scenario is a rebound or bullish slide.
The DMI on the daily chart shows bears losing momentum as the price falls. It is something atypical that opens the door to a sudden change of direction. Bulls continue to fall, but seem to have less momentum.
XRP/USD Daily Chart
XRP/USD is traded at the $0.298 price level and fails to find to support at $0.30.
The good news coming from MasterCard and MoneyGram about the implementation of Xrapid and XRP in their structures does not reflect in the value of XRP.
I am convinced that if Ripple were listed on the NASDAQ, we would see double-digit price increases.
Below the current price, the first support level is at $0.30 (price congestion support), then the second is at $0.295 (price congestion support), and the third one is at $0.292 (price congestion support).
Above the current price, the first resistance level is at $0.308 (price congestion resistance), then the second at $0.32 (double price congestion resistance) and the third one at $0.328 (price co-management resistance).
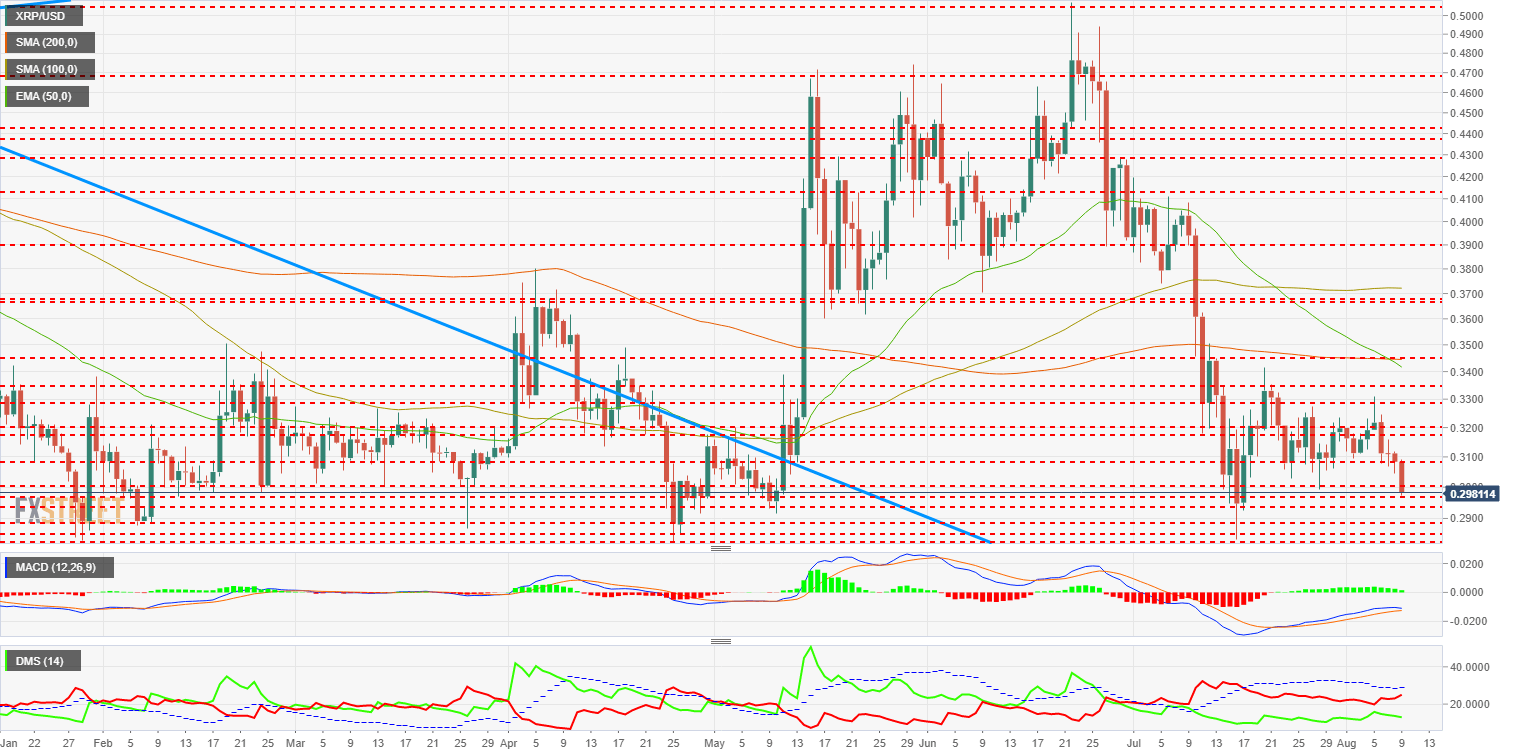
The MACD on the daily chart shows a loss of bullish inclination. The downward turn shows a more aggressive profile than Ethereum, so we cannot rule out a bearish cross.
The DMI on the daily chart shows bears increasing their trend strength, which gives power to the bearish scenario. The bulls, on the other hand, continue to fall and confirm the pessimism about the short-term future of the XRP.
Get 24/7 Crypto updates in our social media channels: Give us a follow at @FXSCrypto and our FXStreet Crypto Trading Telegram channel
Author

Tomas Salles
FXStreet
Tomàs Sallés was born in Barcelona in 1972, he is a certified technical analyst after having completing specialized courses in Spain and Switzerland. He expanded his technical training following the guidance of great experts on the financial markets.


