Top 3 Price Prediction Bitcoin, Ethereum, XRP: Cryptos might pull back
- Bitcoin price is up against a critical resistance zone that will determine the near-term trend.
- Ethereum price extends its two-week rally to a gain of nearly 25%.
- XRP price is stuck at $0.84, bulls unable or unwilling to generate a breakout.

Bitcoin price must cross and close above a critical resistance level to maintain the current uptrend. Ethereum price, unlike Bitcoin, has moved above and is poised to close above the Ichimoku Cloud on the weekly chart, indicating strong sustained upside momentum is ahead. XRP price action, which outperformed BTC and ETH at one point, has been stuck at the $0.84 level since Monday’s close.
Bitcoin price set for a 25% rally or a 10% pullback
Bitcoin price action has been overwhelmingly bullish this week, gaining nearly 7% at publication, with little selling pressure or bearish price action.
However, Bitcoin is right on top of a critical make-or-break point. Despite the powerful bullish performance thus far, if Bitcoin price fails to close above $45,090, it is at risk of triggering another push towards the bottom of the Ichimoku Cloud.
The $45,090 value area contains the top of the weekly Ichimoku Cloud (Senkou Span A), the 61.8% Fibonacci retracement ($44,655), and the top of the current bear flag ($44,888). If bears halt Bitcoin price and cannot close above that level, bears may see an opportunity to trap bulls and initiate another push towards the bottom of the Ichimoku Cloud near $38,000.
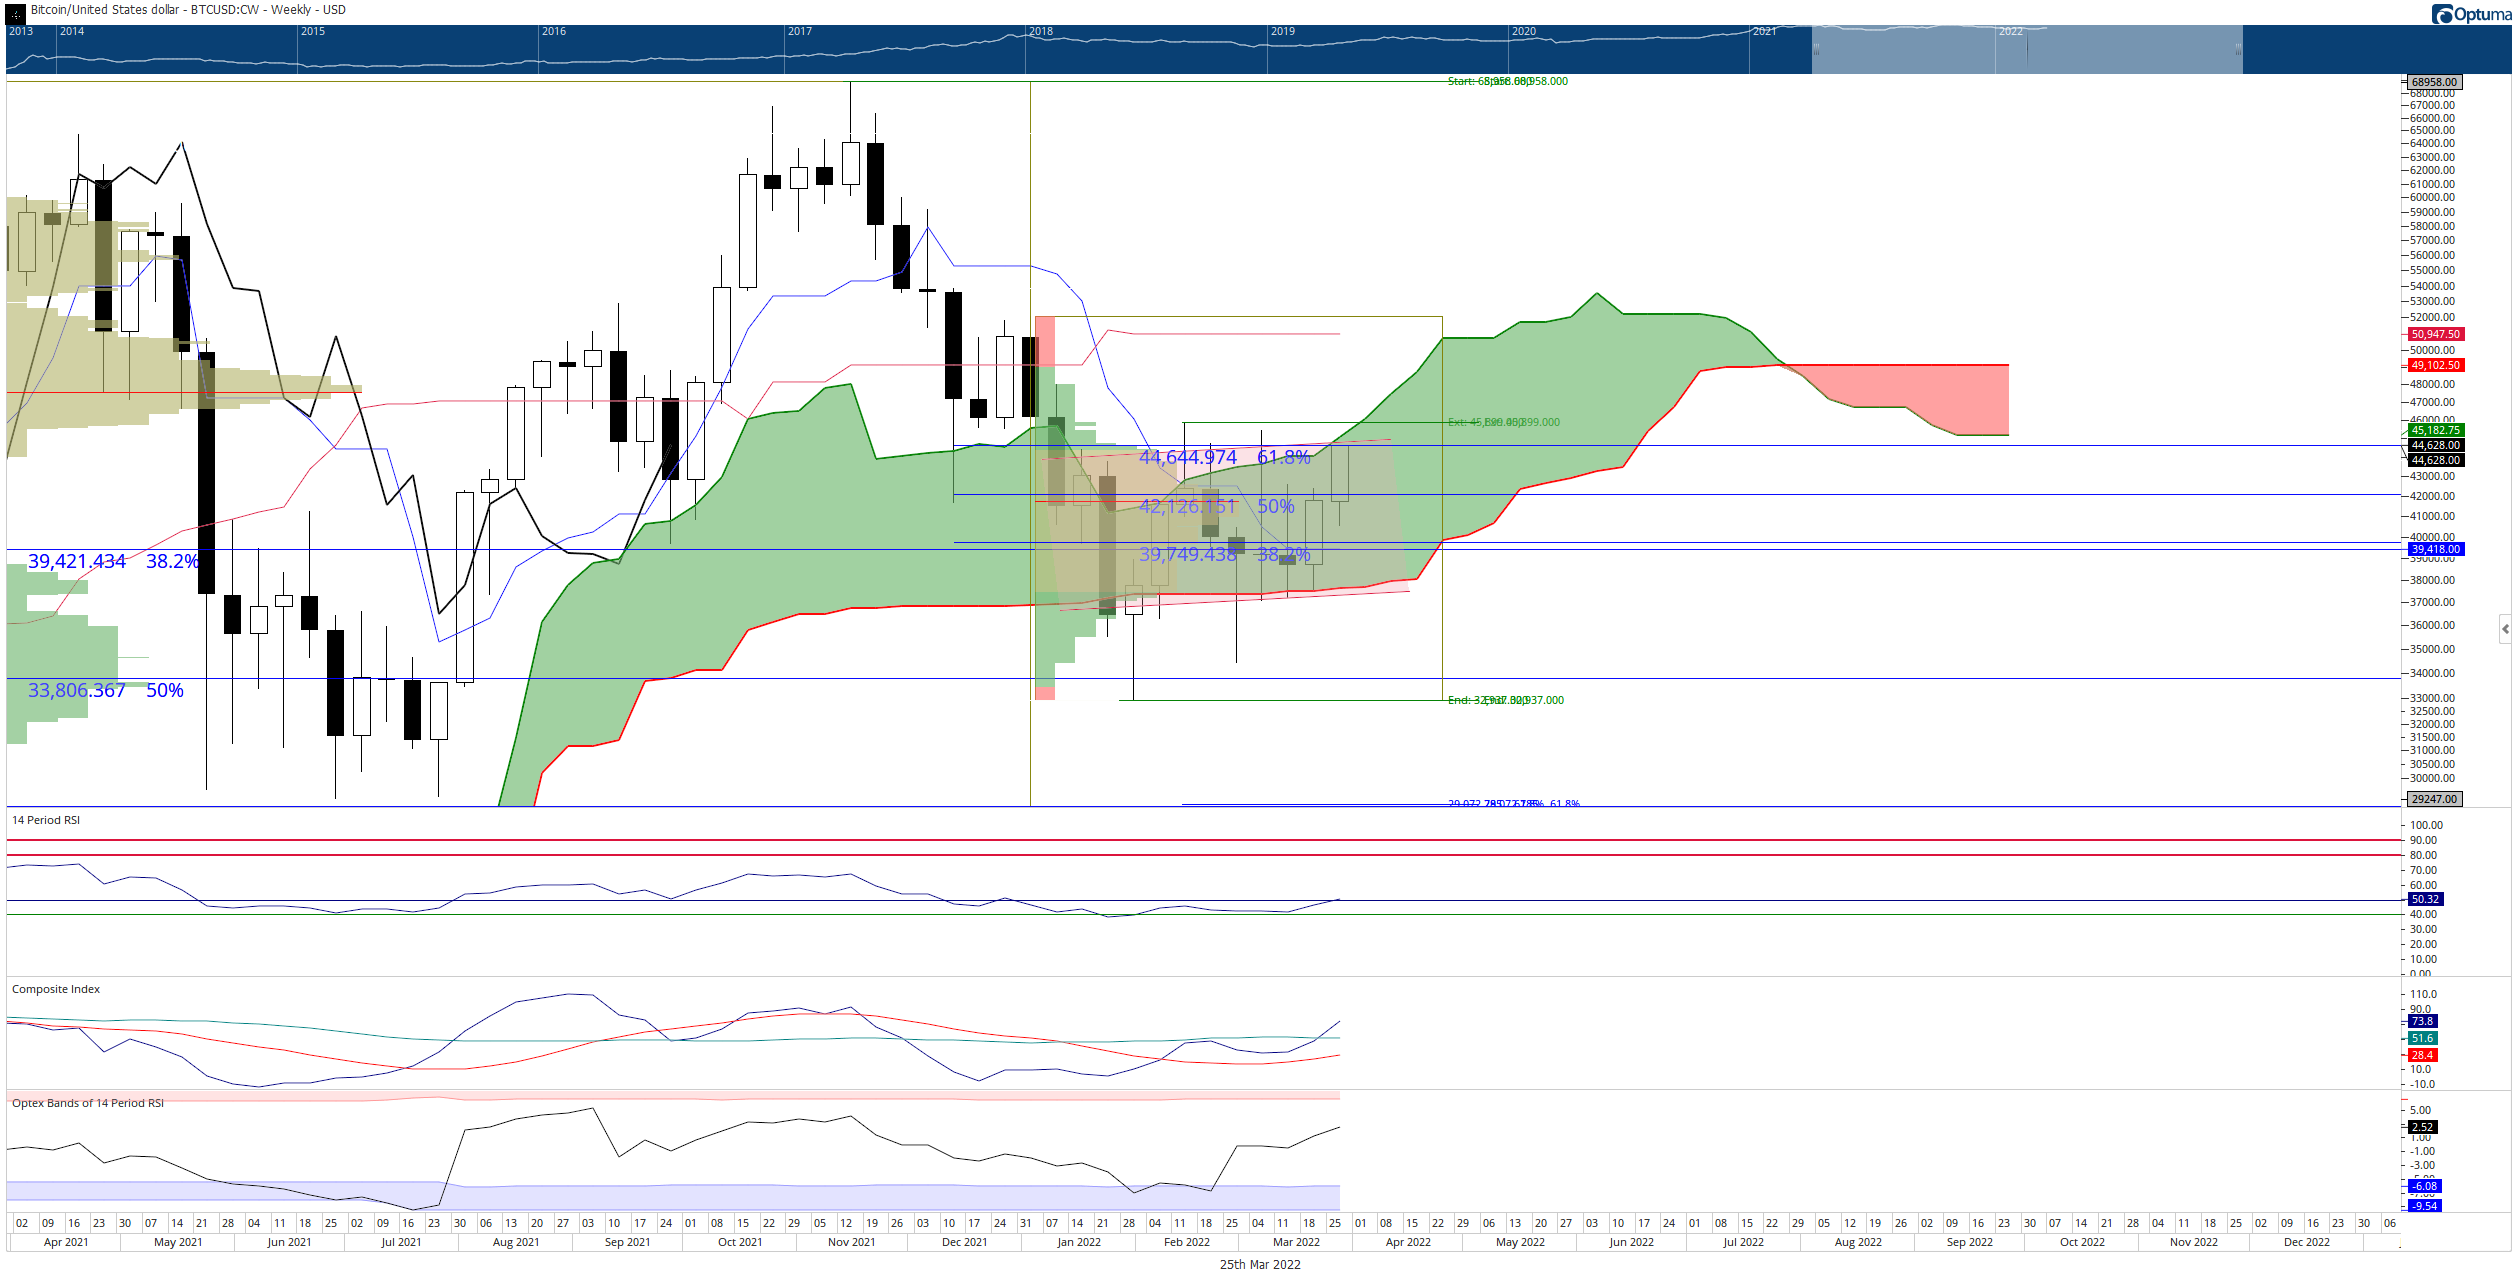
BTC/USD Weekly Ichimoku Kinko Hyo Chart
If buyers successfully close Bitcoin price at or above $45,100, then the next Ichimoku resistance level doesn’t appear until the Kijun-Sen at $50,910, slightly above the 2021 Volume Point Of Control at $47,787. Upside potential is likely limited to the $48,000 to $50,000 over the next week.
Ethereum price cracks above the Ichimoku Cloud
Ethereum price, at the time of publication, is close to completing a weekly close above the Ichimoku Cloud. There were concerns on Wednesday and Thursday whether this event could or would occur, but unless something drastic changes, ETH is poised to complete a very bullish event.
Upside potential, however, may be limited to the $3,300 value area until next week. In addition, the bottom trendline of a prior bull flag and the 38.2% Fibonacci retracement may halt any upside movement over the weekend. But the weekly oscillators do show that a sustained move higher is very likely.
The Relative Strength Index remains in bull market conditions and has been stuck between the two oversold levels of 40 and 50 ever since the week of January 7, 2022. The angle currently shows a probable breakout above the 50 level. Additionally, the Optex Band oscillator is turning up from the extremely oversold level for the first time in eight weeks.
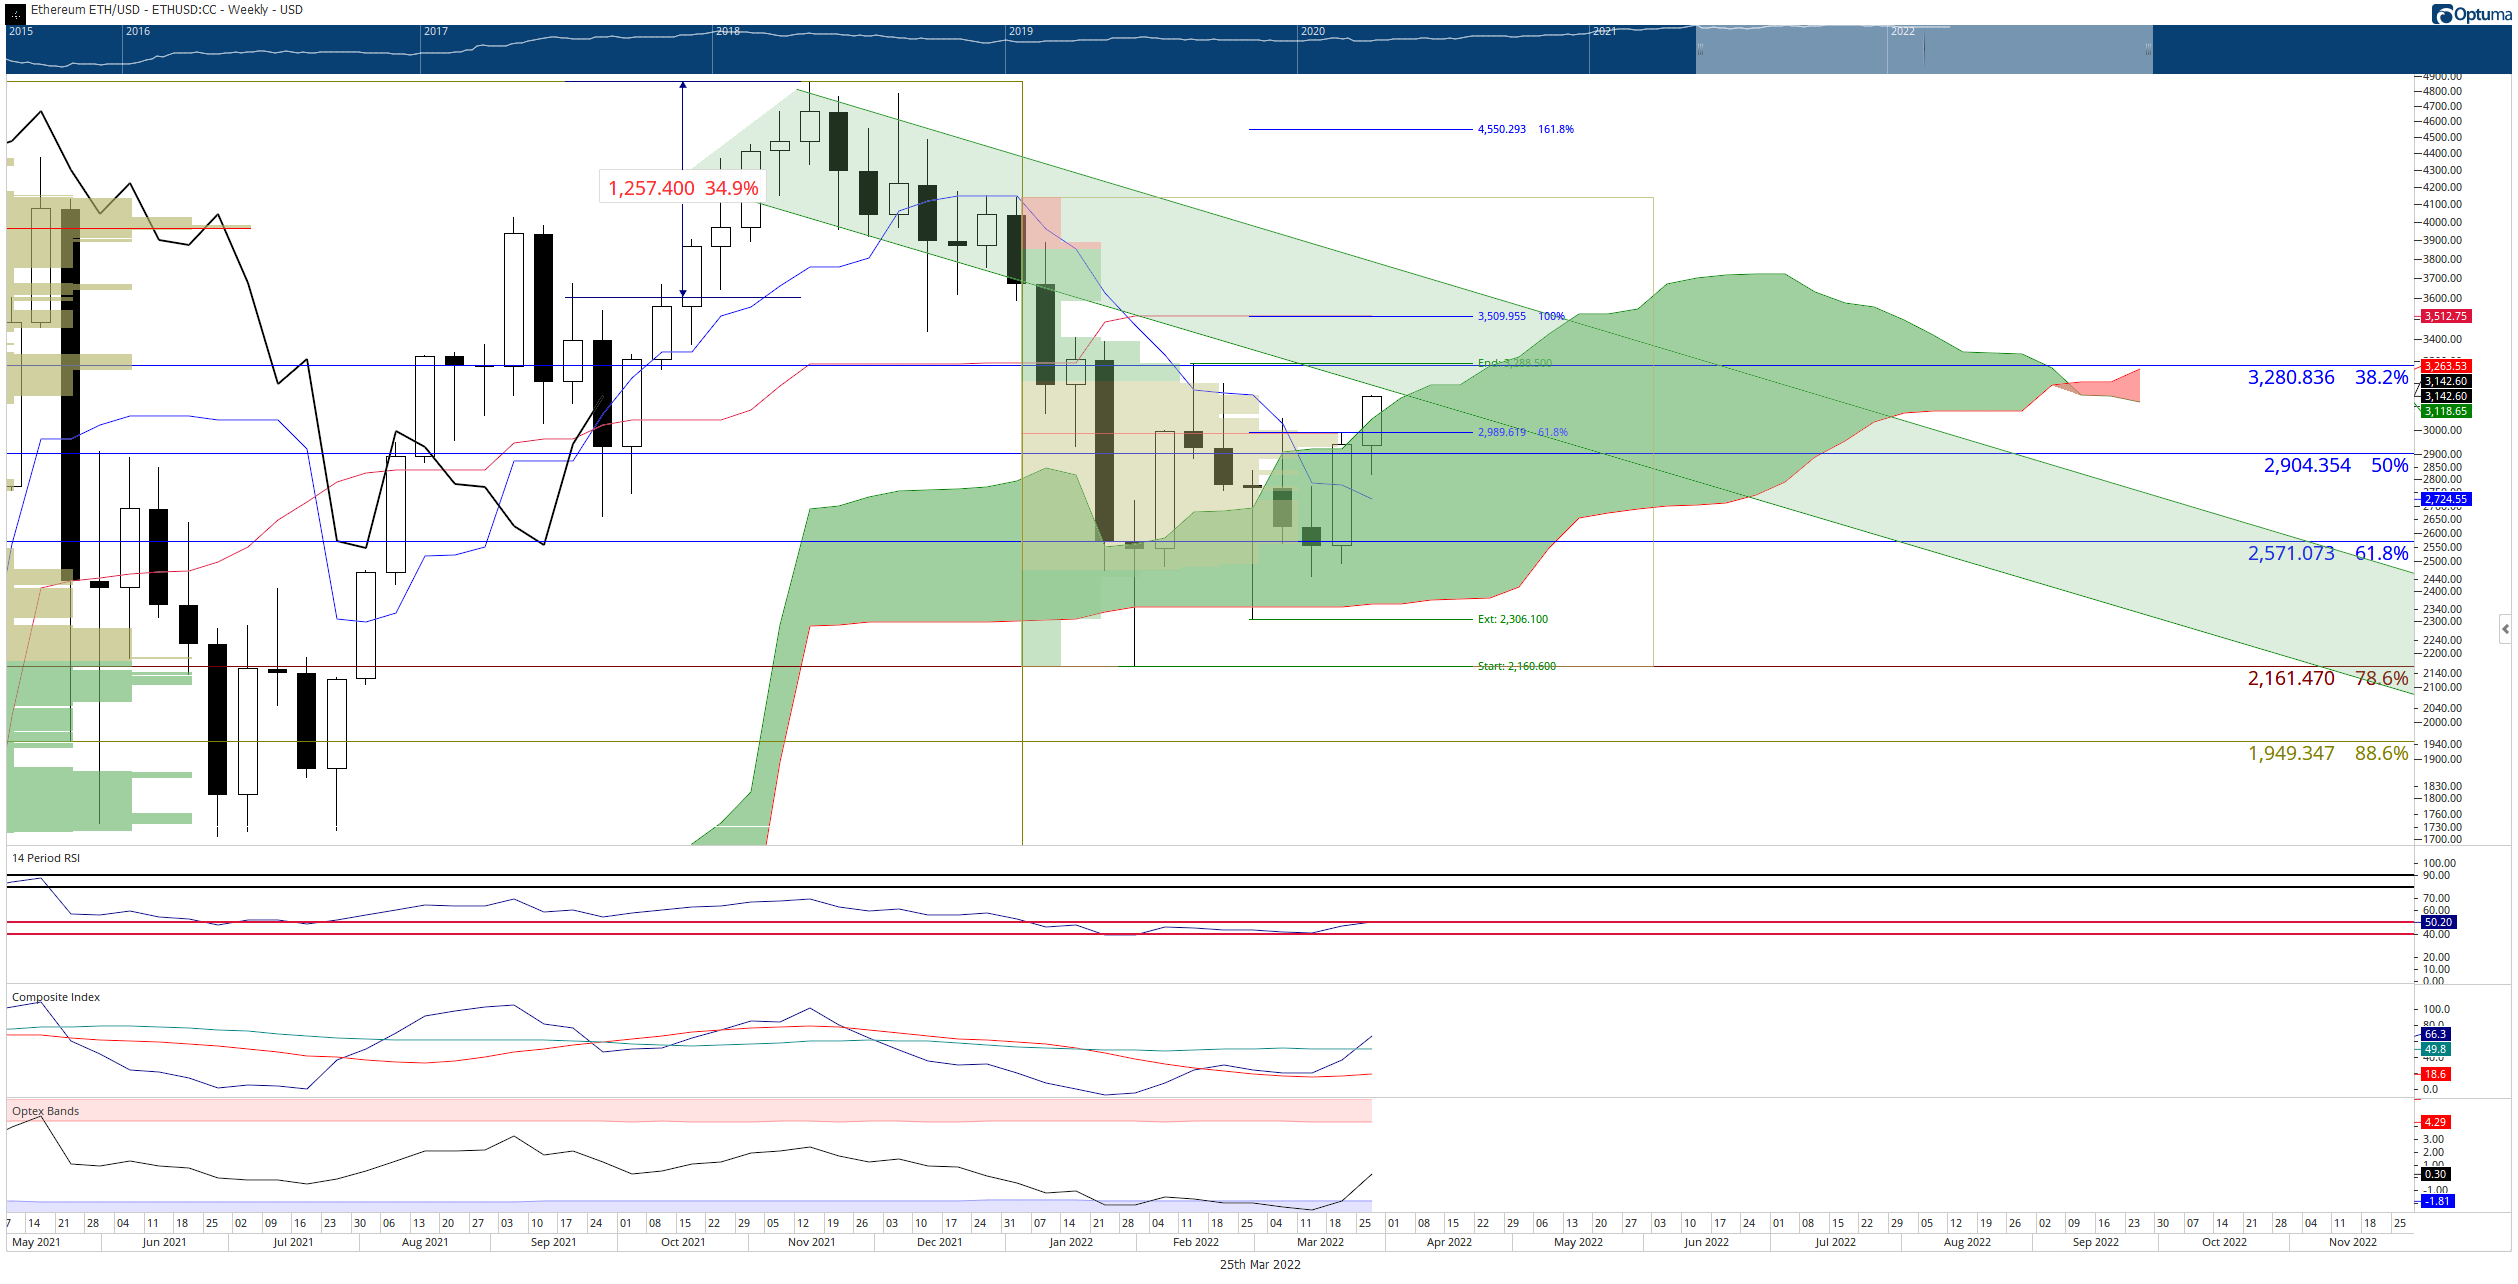
ETH/USD Weekly Ichimoku Kinko Hyo Chart
For Ethereum price bulls, the most important oscillator measure to watch is November 12, 2021 peak in the Composite Index. If the Composite Index forms a peak above the November 12, 2021 peak – but price has not made a new high above the November 12, 2021 price high, then it would create hidden bearish divergence, pointing to a continuation move south.
XRP price awaits a clear breakout higher, but bulls appear apprehensive
XRP price has been against the 38.2% Fibonacci retracement near $0.84, with very little pressure to move above or below that level. XRP remains in a Bullish Ichimoku Breakout setup – but lacks any follow-through.
If XRP price does find sellers, then a pullback to the daily Tenkan-Sen at $0.82 may be their primary target. A breach of the Tenkan-Sen on the daily Ichimoku chart would mean a test even lower to the Kijun-Sen at$0.78. Upside potential over the weekend and into early next week is likely the $1.00 to $1.05 value area.
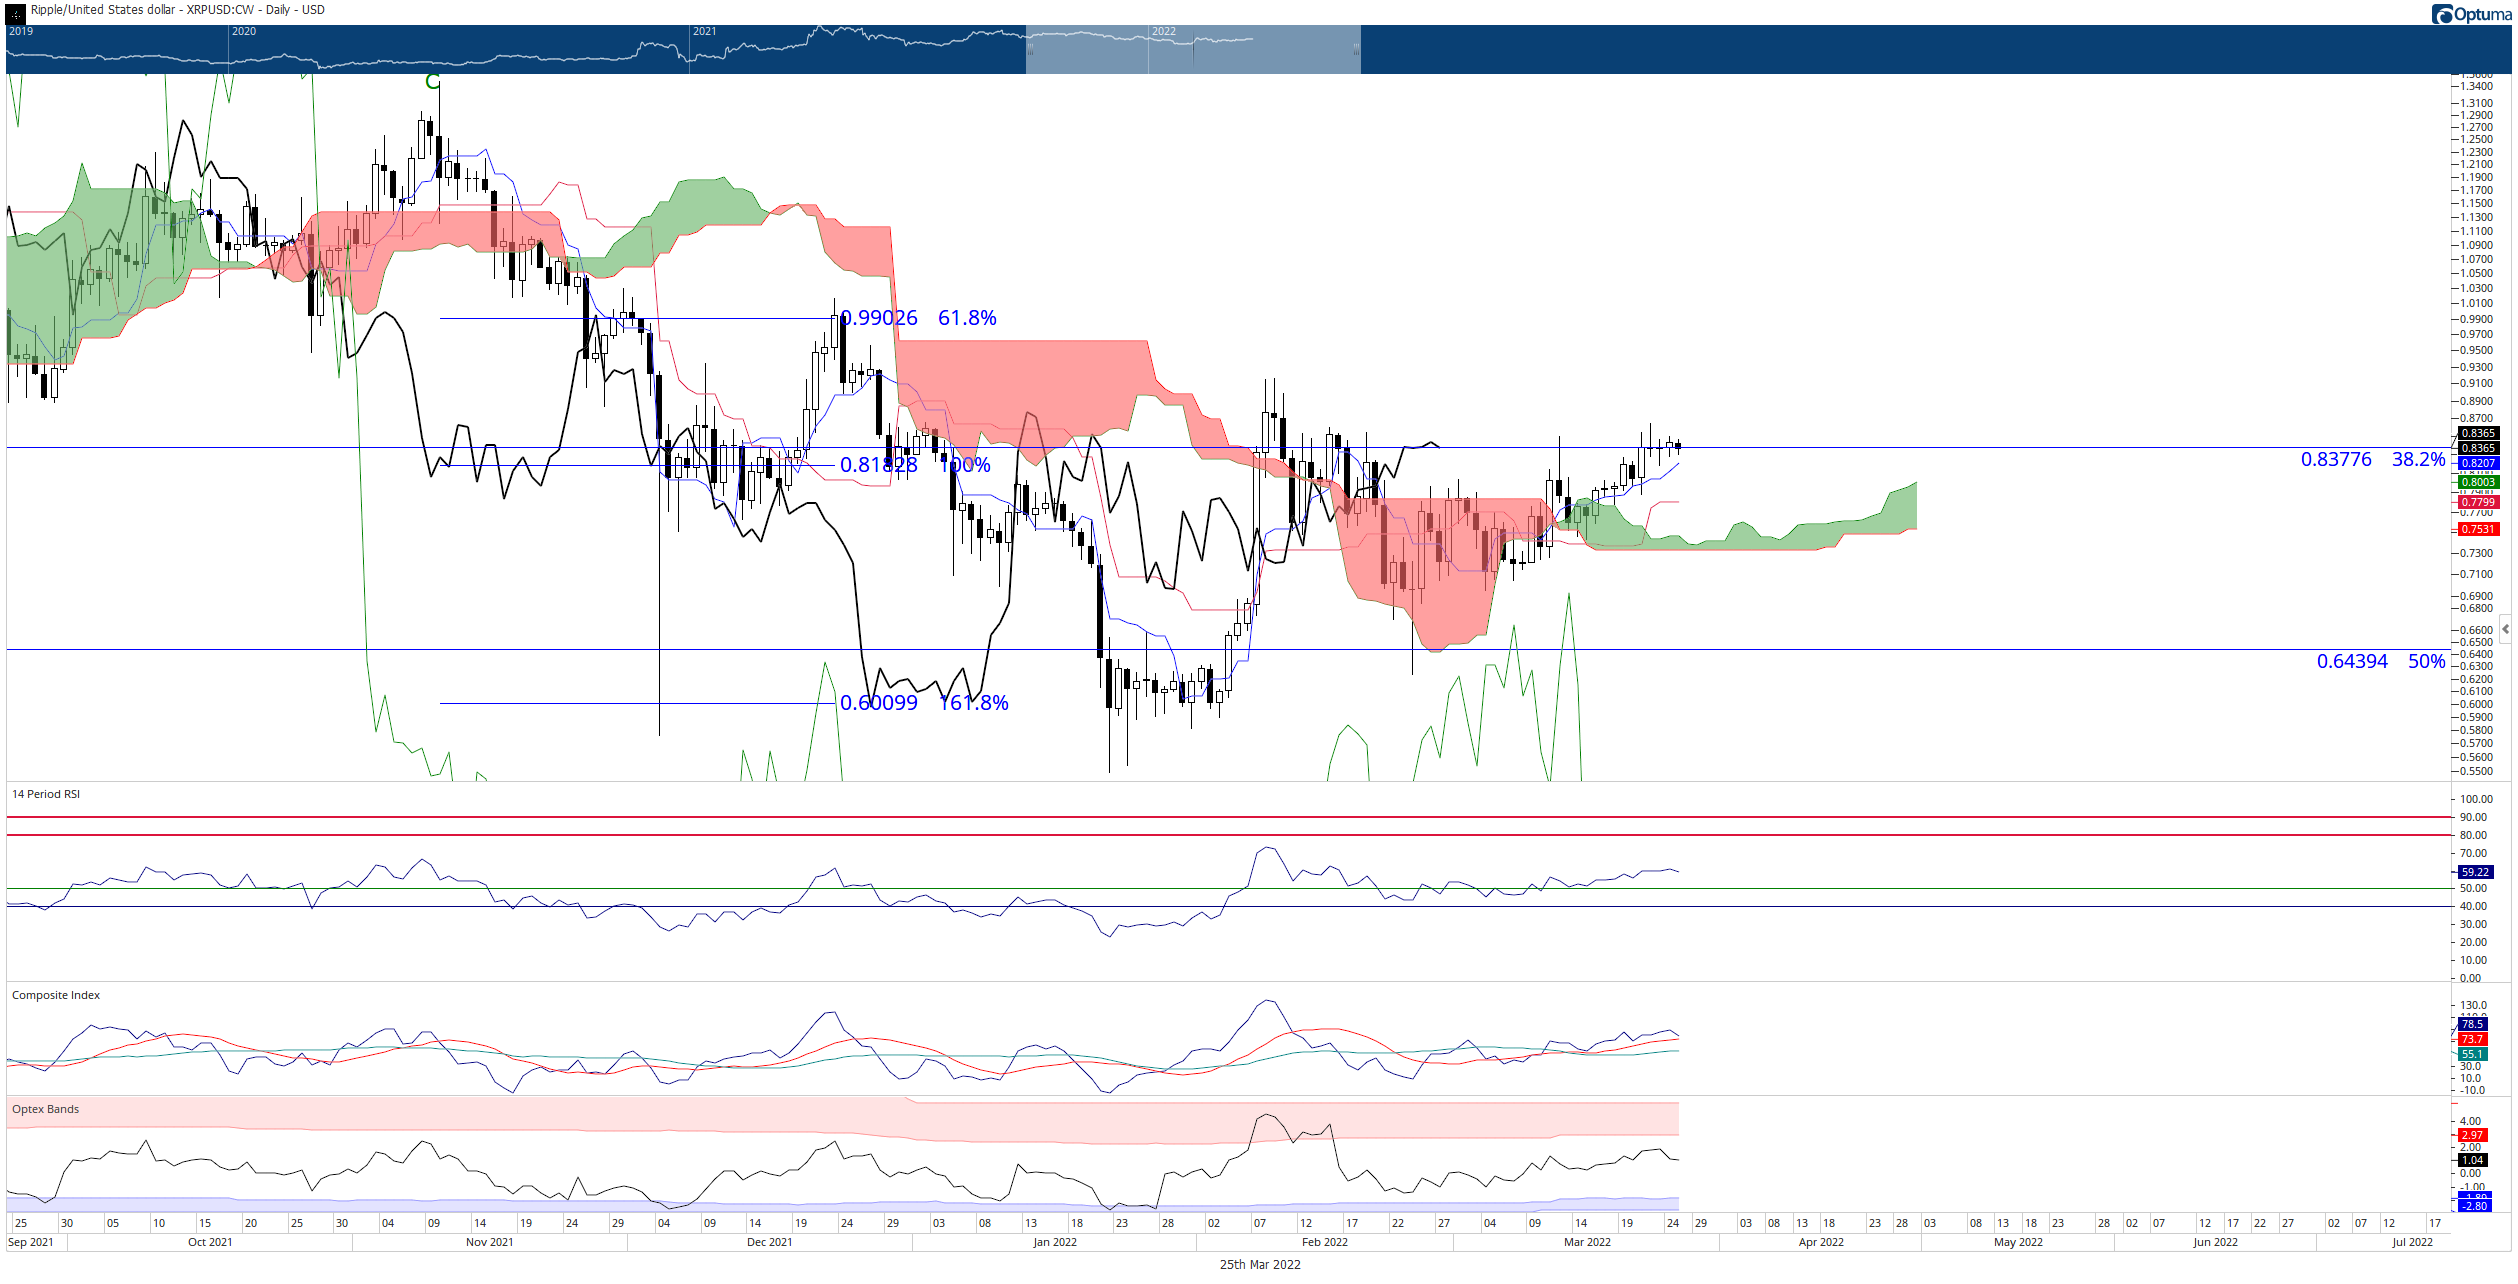
XRP/USD Daily Ichimoku Kinko Hyo Chart
However, downside risks remain a concern. XRP price remains inside a bearish continuation pattern. A daily close at or below $0.73 could trigger substantial selling pressure down to the $0.50 value area.
Author

Jonathan Morgan
Independent Analyst
Jonathan has been working as an Independent future, forex, and cryptocurrency trader and analyst for 8 years. He also has been writing for the past 5 years.



