Bitcoin Weekly Forecast: Buyers euphoric, but BTC is not out of the woods yet
- Bitcoin price has tagged the upper trend line of the ascending triangle at $44,000.
- While a flip of the 50-day and 100-day SMAs are bullish, BTC needs to overcome a few more hurdles.
- A weekly candlestick close below $35,000 will invalidate the bullish thesis.

Bitcoin price shows a retest of the upper range of its consolidation after rallying for nearly two weeks. This uptrend will now face multiple hurdles that will decide the outlook for BTC in the near future.
Bitcoin price ready for more gains
Bitcoin price looks ready for more uptrend but it is currently approaching the upper boundary of an ascending triangle. This technical formation contains trend lines drawn across equal highs and higher lows.
The target or this setup is obtained by measuring the distance between the first swing high and swing low to the breakout point. For BTC, this target is at $53,855 but the bulls need to overcome multiple hurdles to reach their destination.
Although the recent upswing has sliced through the 50-day and 100-day Simple Moving Averages (SMAs), Bitcoin needs to clear a few more hurdles. The weekly supply zone, extending from $45,550 to $51,860 is a major blockade that also harbors the 200-day SMA.
Therefore, a weekly candlestick close above $52,000 will set a higher high relative to the highs formed in December 2021 and suggest the start of an uptrend. In such a case, market participants can expect BTC to head for the $60,000 psychological barrier, bringing the total gain to 36% from the current position - $43,972.
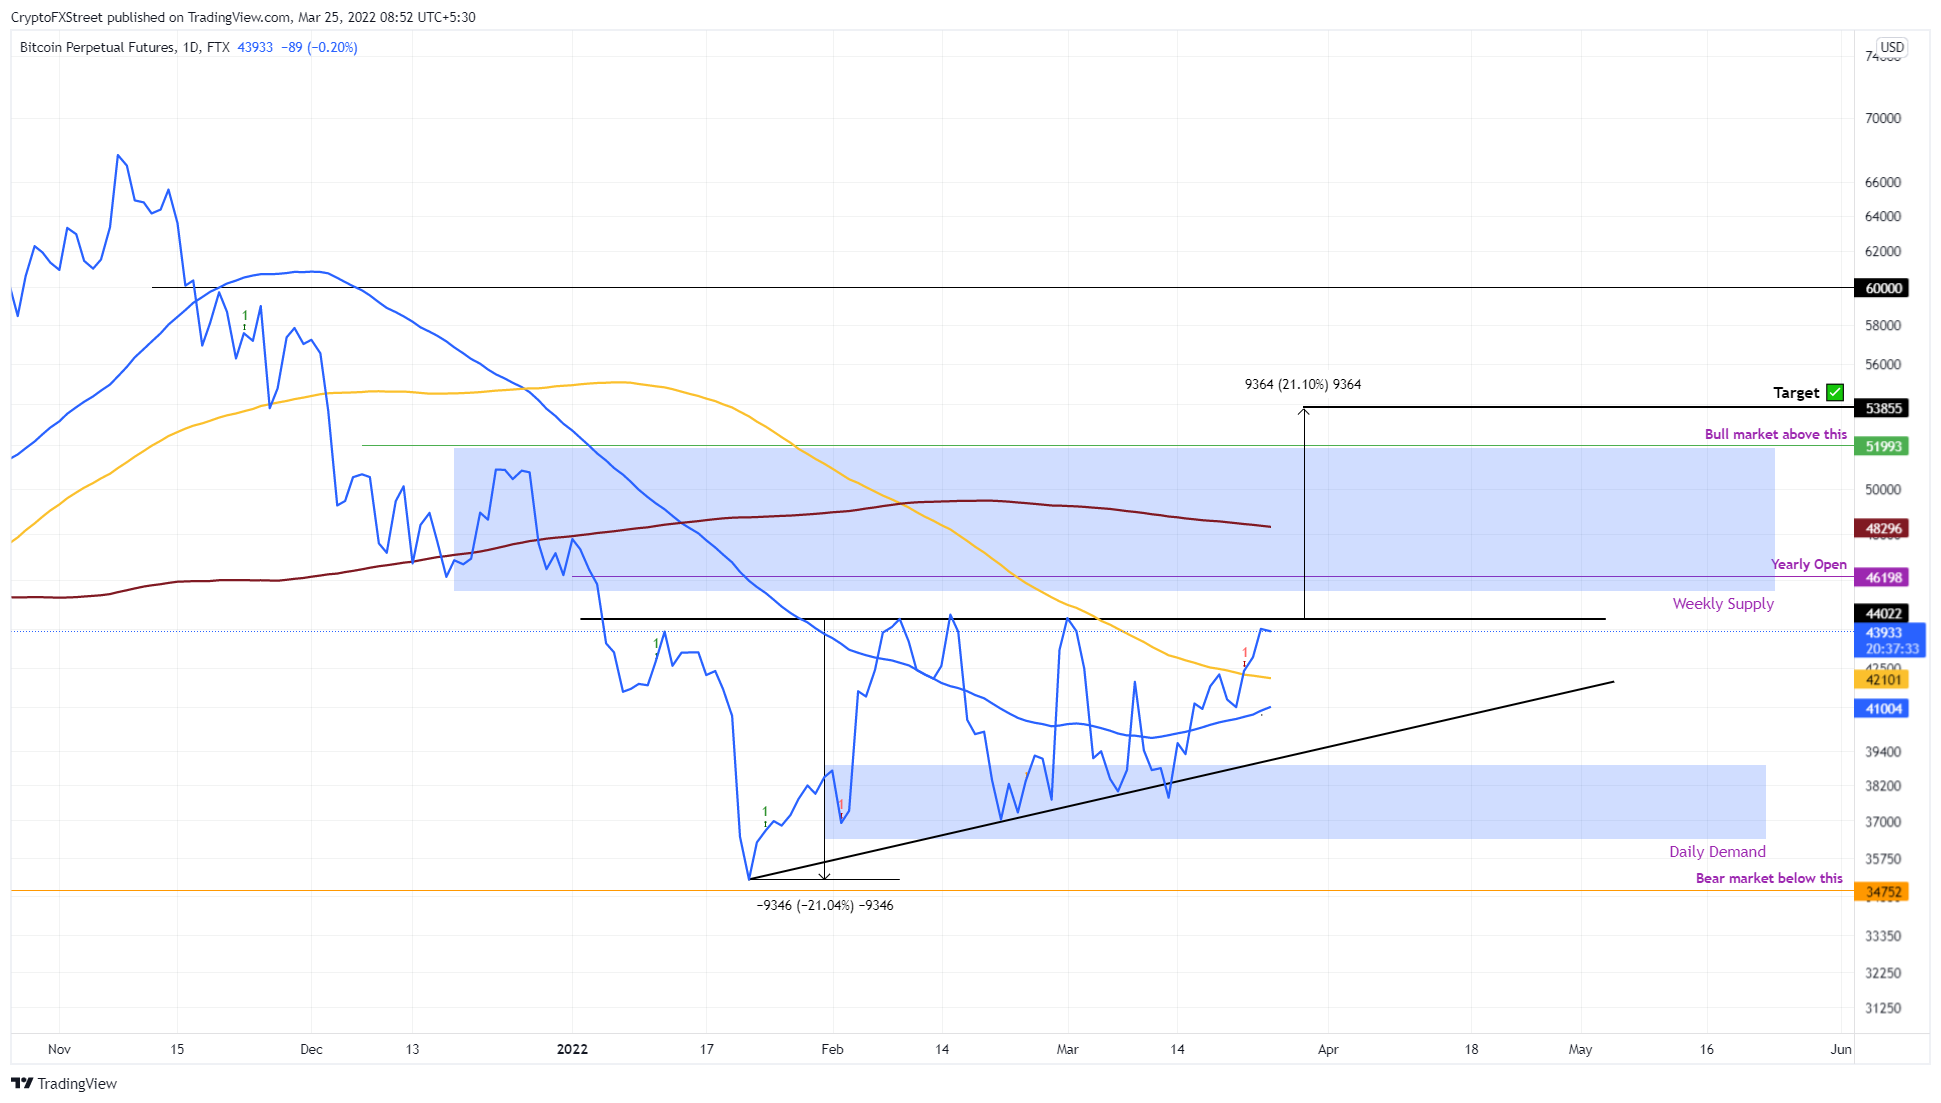
BTC/USDT 1-day chart
While optimism is not lacking after the recent run-up, IntoTheBlock’s Global In/Out of the Money (GIOM) model shows that Bitcoin price is currently facing a hurdle that extends from $43,719 to $50,874.
The 5.92 million addresses that purchased roughly 3.15 million BTC at an average price of $47,653 are “Out of the Money.” Clearing this thicket of underwater investors will not rid BTC of its woes as the next cluster of investors that purchased 2.98 million BTC at an average price of $58,153 are also at a loss.
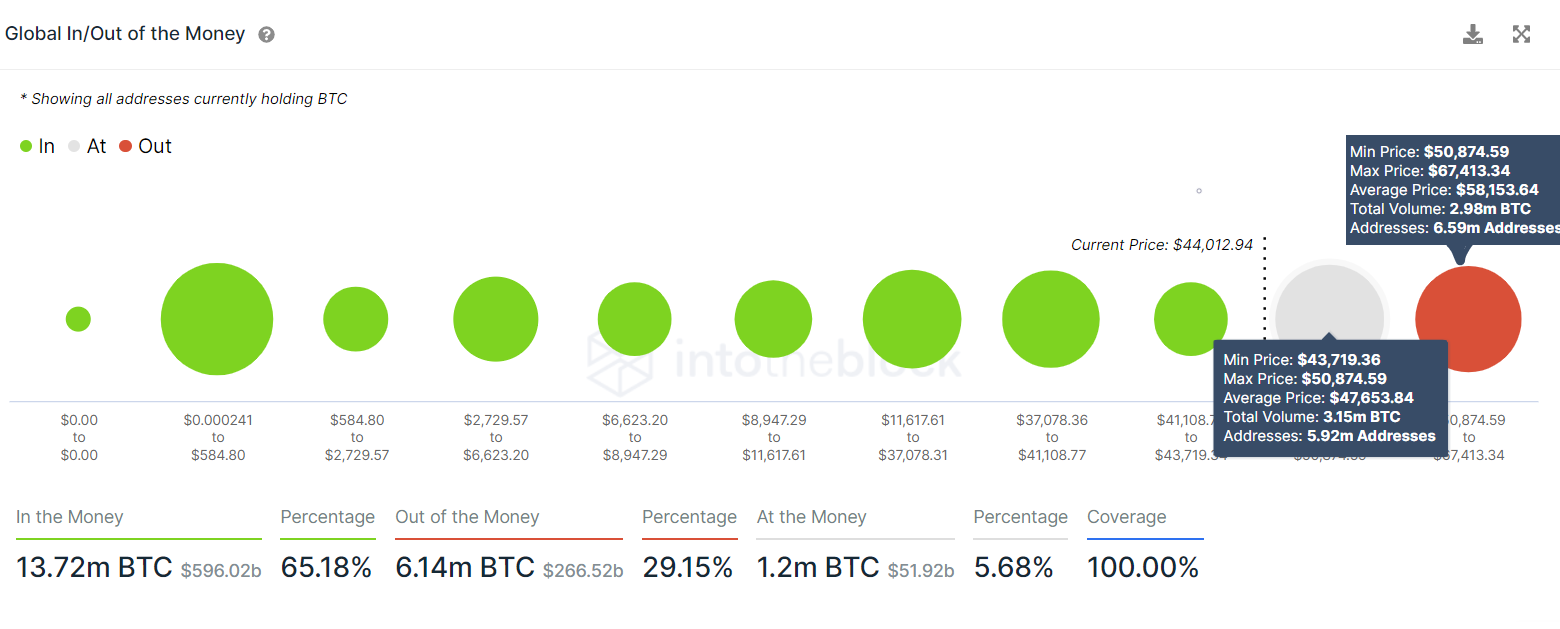
BTC GIOM
The uptick in buying pressure seems to have liquidated quite a bit of short-sellers, but the on-chain volume and daily active addresses (DAA) have not reflected anything out of the ordinary.
In fact, the number of DAA has decreased from 1.09 million to 0.95 million since March 2. The on-chain volume during the same period has remained relatively the same at 30 billion.
 [08.27.20, 25 Mar, 2022]-637837814054150409.png)
BTC DAA, on-chain volume
The 30-day Intraday Market Value to Realized Value (MVRV) is similar to the MVRV indicator and is used to determine the average profit/loss of investors that purchased BTC over the past month.
A spike in the MVRV value indicates that short-term holders are in profit and are likely to realized profit by selling. For Bitcoin, the recent uptick in buying pressure has pushed the 30-day intraday MVRV to 6.5%.
Interestingly, the last three times Bitcoin price tagged $44,000 or higher levels, this index was also hovering above 6% and marked a local top, leading to a 15% to 20% crash. If history is any indication, investors need to exercise caution and beware of a potential crash that could be brewing.
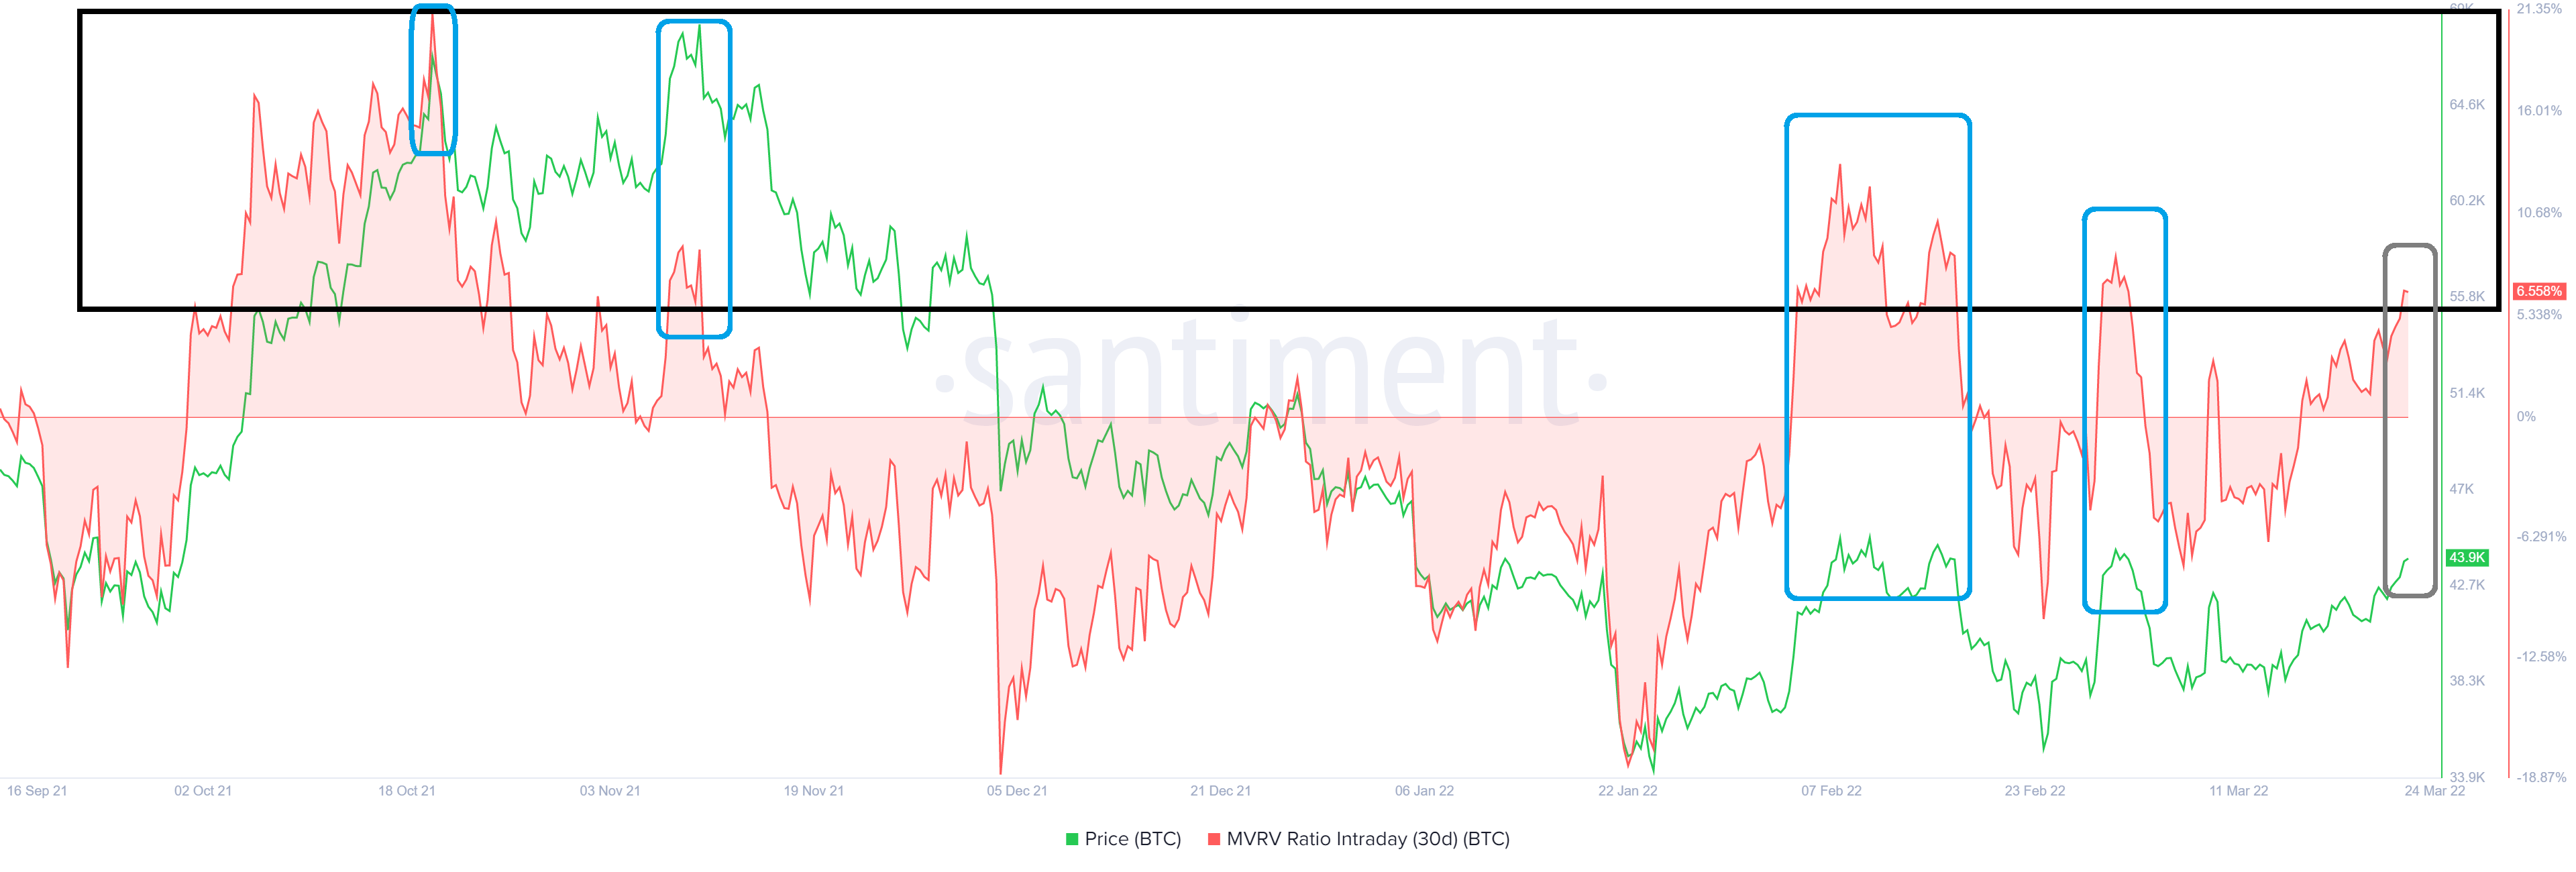
BTC 30-day intraday MVRV
Moreover, the sentiment shows that investors have moved quickly from ‘extreme fear’ to ‘neutral’ over the past week. The last two times, the Fear and Greed Index hit 50 to 54, BTC price underwent a steep correction. As this metric hovers around 47, investors need to ask themselves if this run-up will break the trend or if history will repeat itself.
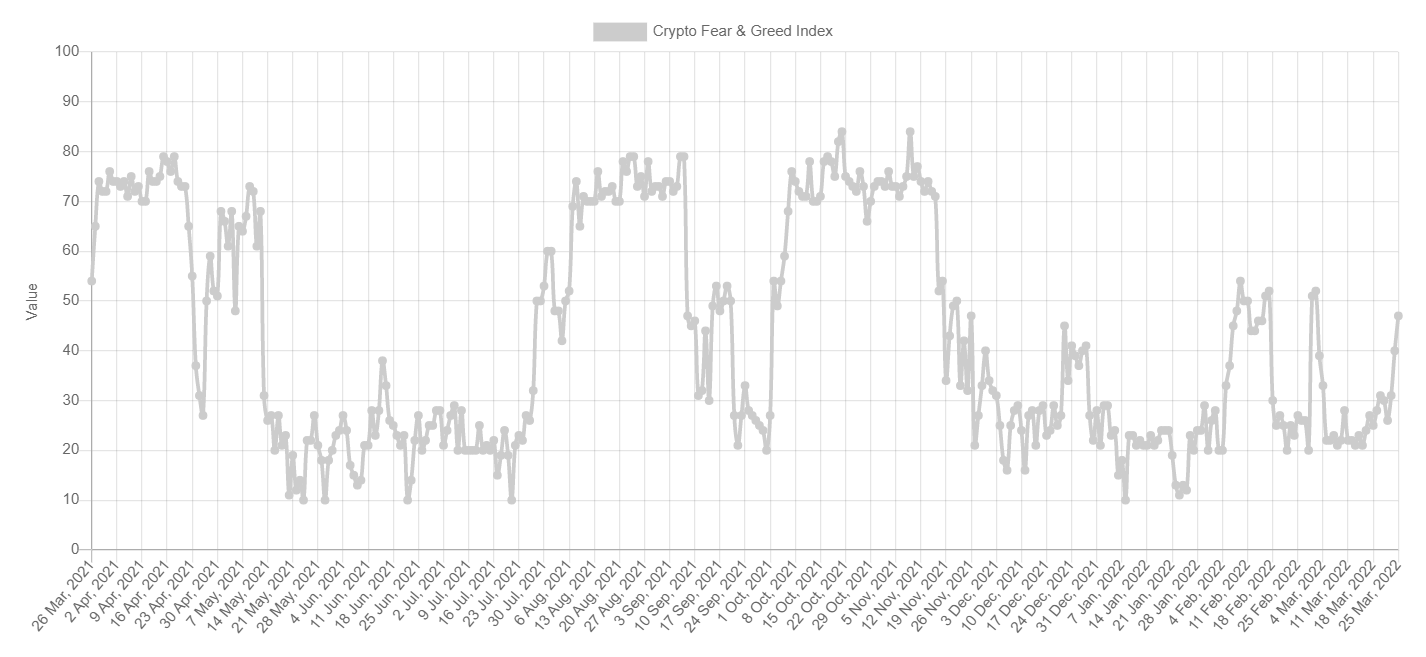
BTC fear and greed index
While it is easier to remain optimistic, market participants need to be prepared for a bearish scenario. If Bitcoin price fails to breach through the ascending triangle’s upper trend line at $44,418, it will likely pull back and retest the lower trend line at $40,000 or $38,000.
In a worst-case scenario, Bitcoin price could shatter the daily demand zone, extending from $38,895 to $36,398, triggering a flash crash to $35,000. If bulls fail to hold above this support level, it will invalidate the bullish thesis and catalyze a move $30,000 or lower.
Author

Akash Girimath
FXStreet
Akash Girimath is a Mechanical Engineer interested in the chaos of the financial markets. Trying to make sense of this convoluted yet fascinating space, he switched his engineering job to become a crypto reporter and analyst.




