Top 3 Price Prediction Bitcoin, Ethereum, Ripple: Cryptos face market-wide profit-taking
- Bitcoin price mean reversion could trigger a 25% drop.
- Ethereum faces at least a 16% drop to cover existing Ichimoku gaps.
- XRP could outperform Bitcoin and Ethereum by consolidating instead of selling-off.

Bitcoin price action remains extended from its weekly Tenkan-Sen, suggesting a retracement is likely to occur. Ethereum price, like Bitcoin, is exposed to significant gaps on its weekly Ichimoku chart. XRP price may surprise market participants by outperforming Bitcoin and Ethereum for the first time in many months.
Bitcoin price overextended, deep retracement incoming
Bitcoin price continues to have significant gaps between the bodies of the weekly candlesticks and the weekly Tenkan-Sen. Gaps between the Tenkan-Sen and candlestick bodies generally resolve over five to six periods, a period that Bitcoin is currently at the end of. Therefore, unless Bitcoin were to consolidate and trade sideways, the next move is for Bitcoin to travel lower to return to the Tenkan-Sen.
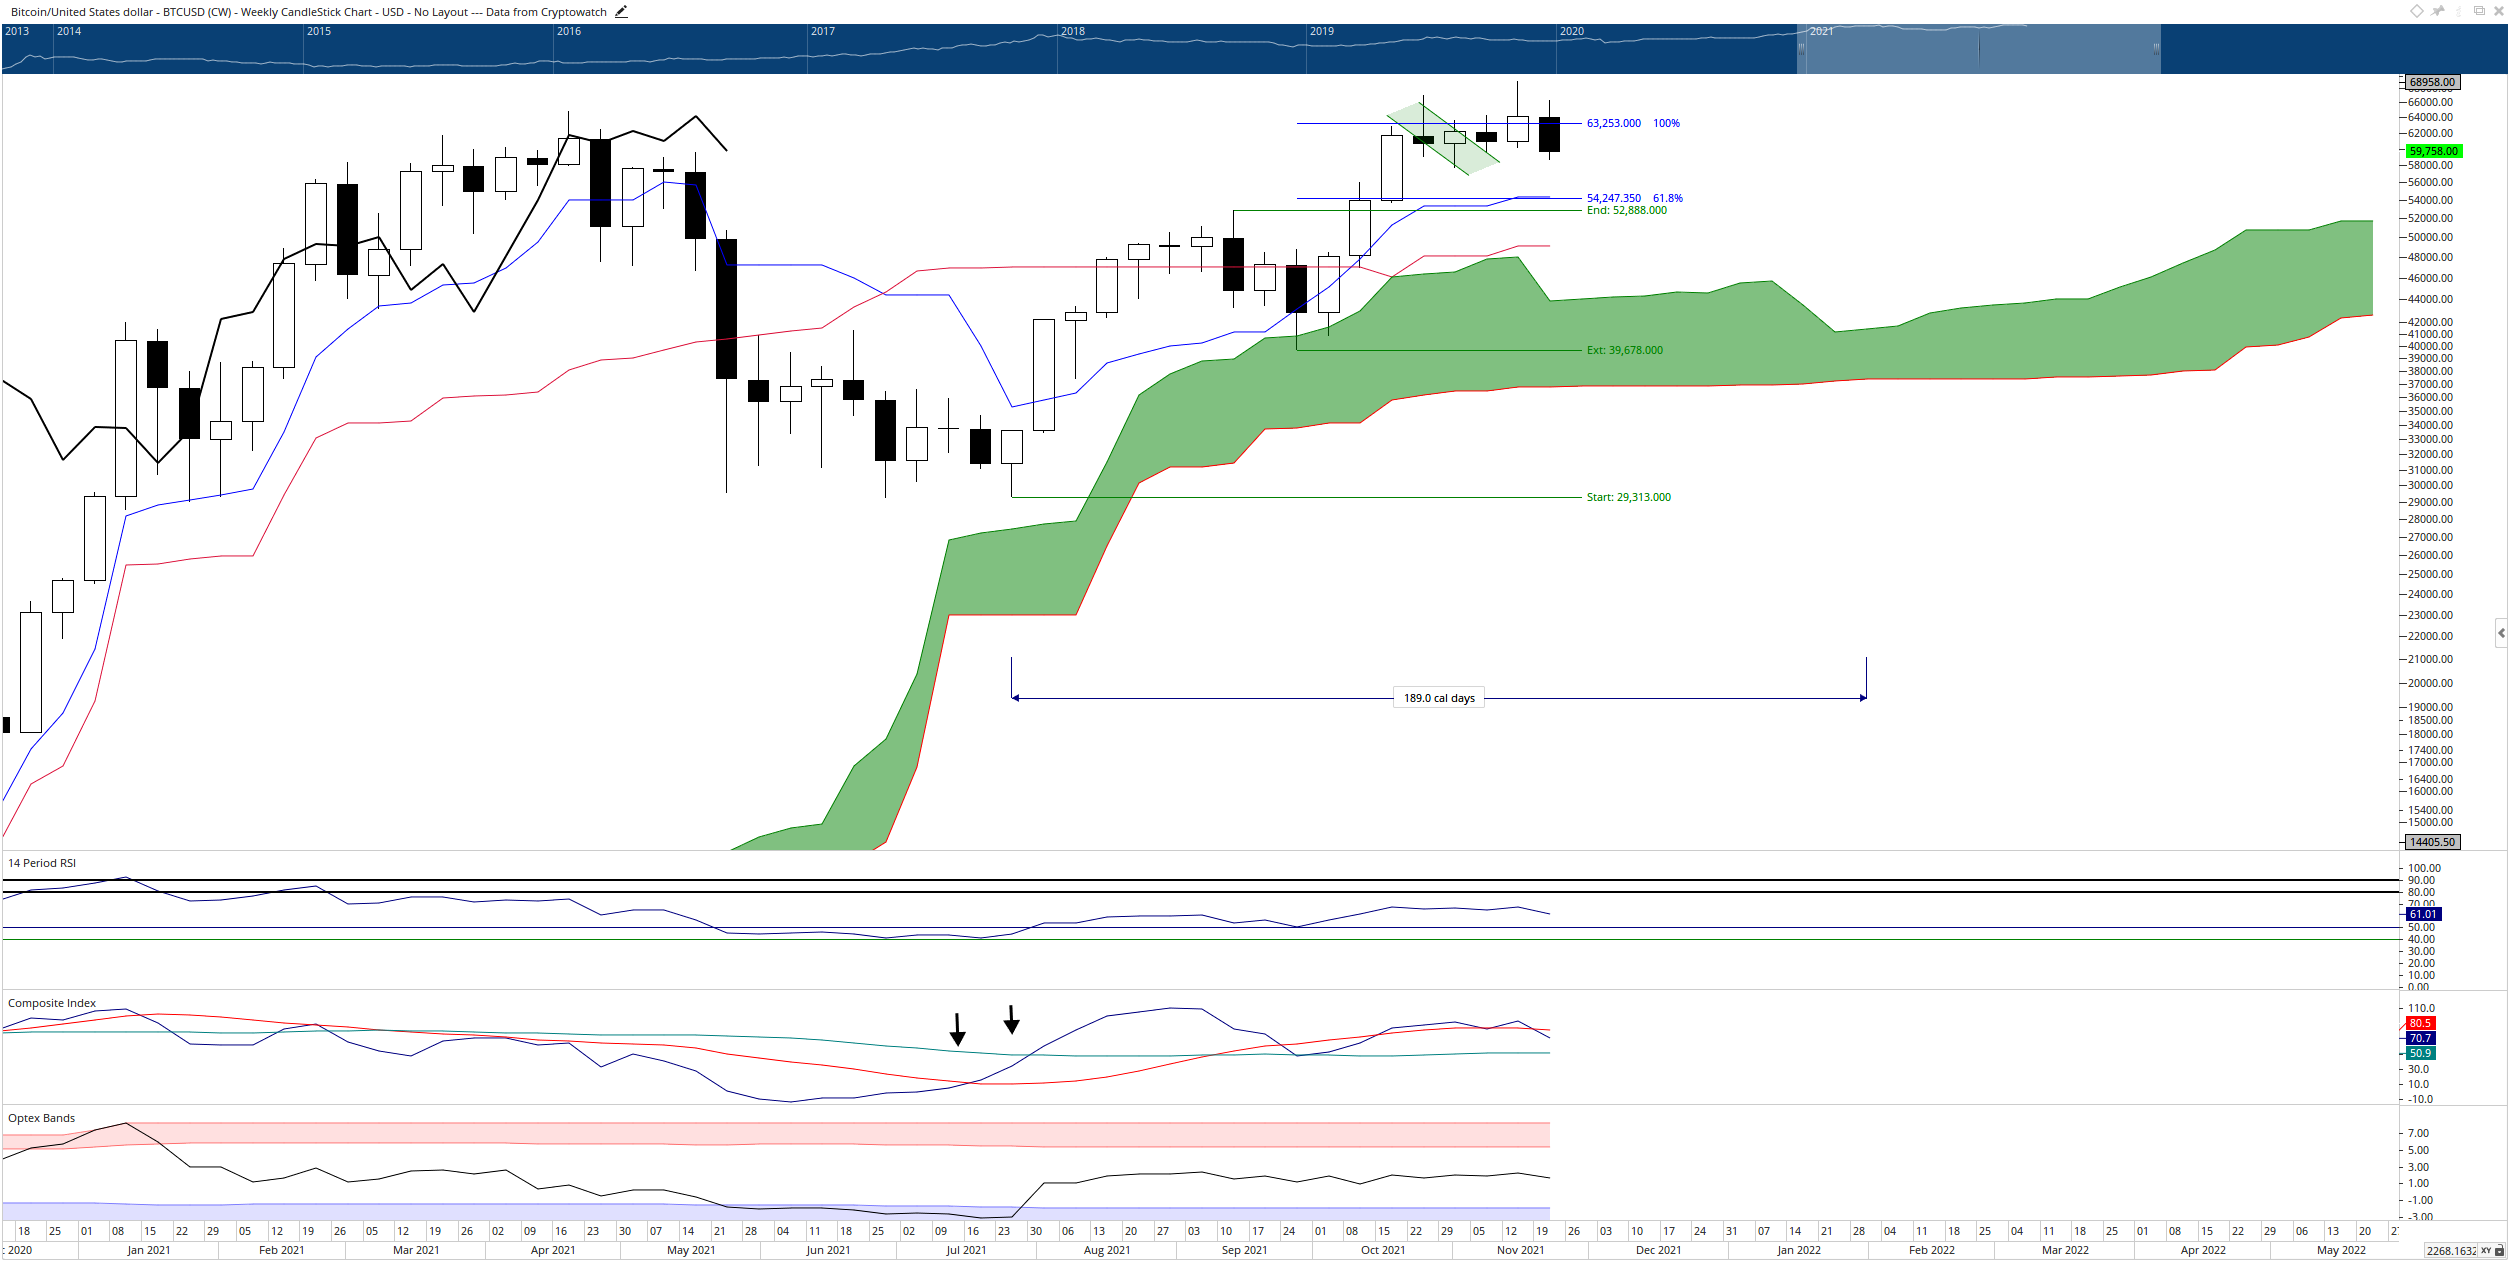
BTC/USD Weekly Ichimoku Chart
However, given the extended nature of Bitcoin's drive, some deeper profit-taking may occur and traders may instead push Bitcoin even lower to the confluence zone of the Kijun-Sen and 2021 Volume Point Of Control at $48,250. The bearish outlook will be invalidated if Bitcoin creates new all-time highs.
Ethereum price faces return to $3,800
Ethereum price action is very top-heavy and due for a pullback. The price structure is almost identical to Bitcoins, but Ethereum may be more susceptible to a deeper retracement due to the consecutive seven-week bullish candlesticks. In addition, the 61.8% Fibonacci expansion at $4,500 has acted as a reasonably strong resistance level.
The most critical level to watch is the Composite Index, which has a bearish pennant. Additionally, the Composite Index has three lower peaks, while the candlestick chart has printed three higher peaks, creating bearish divergence.
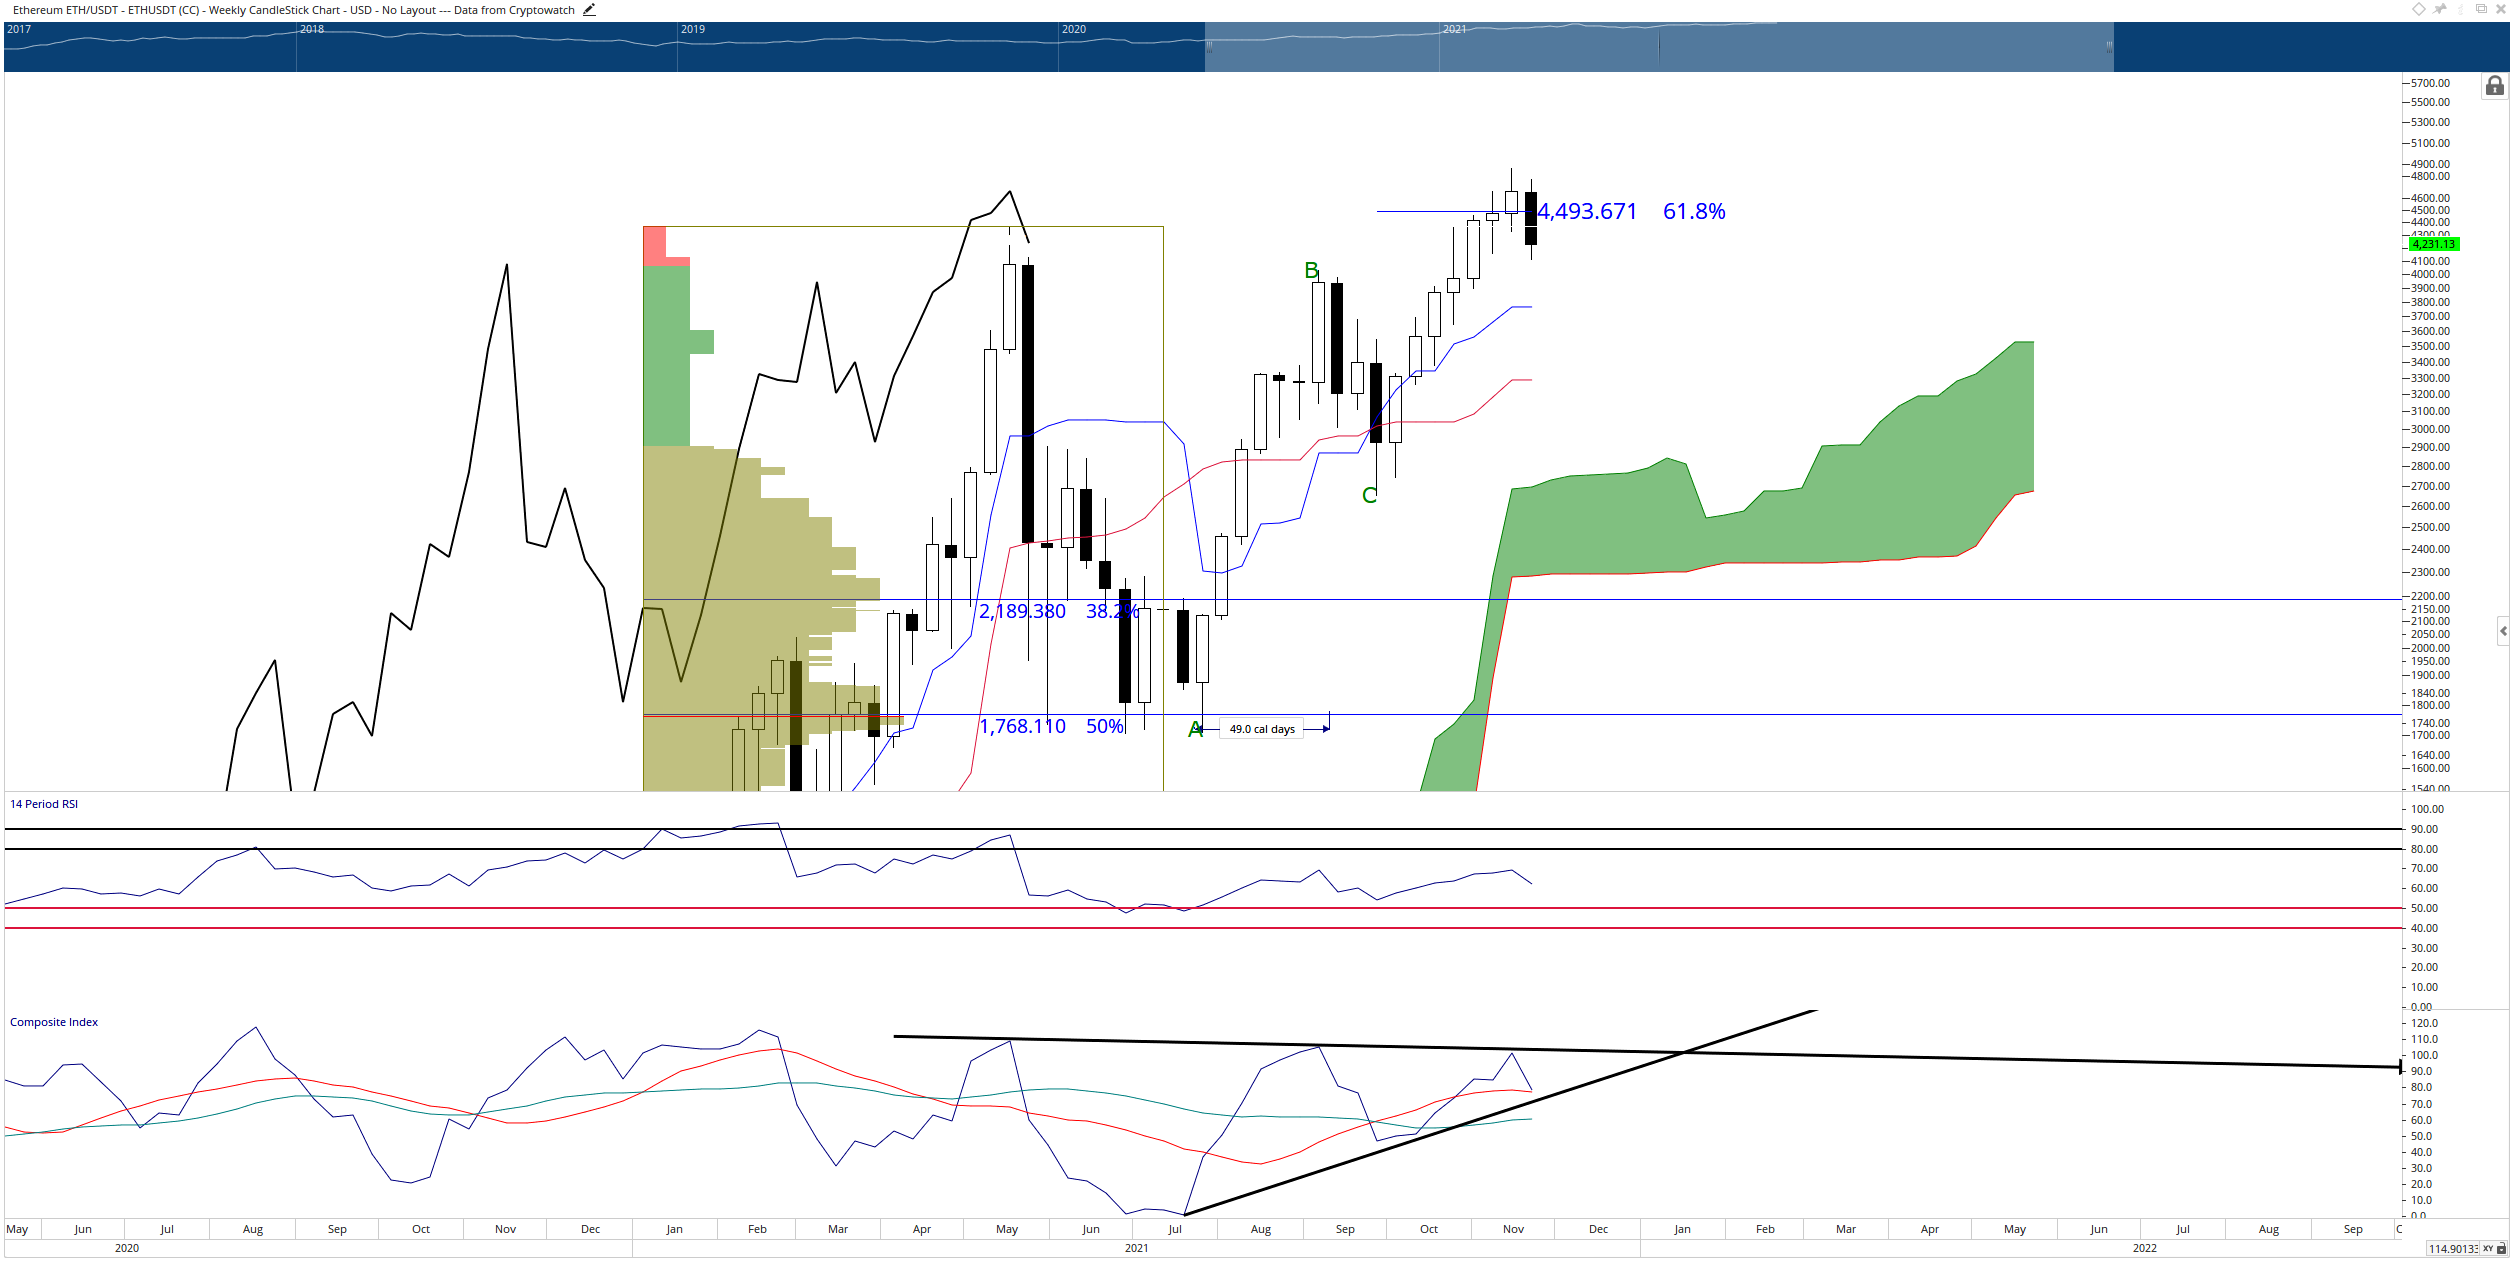
ETH/USD Weekly Ichimoku Chart
Given the current time cycle and extended price action, invalidation of the bearish outlook may be difficult to terminate. Significant and sustained highs beyond the more recent new all-time highs would need to be sustained.
XRP price may trade sideways, limiting downside risks
XRP price is currently against a robust series of price levels, creating a firm support level. Between the price levels of $1.08 and $1.14, the daily Kijun-Sen, Senkou Span A, Senkou Span B, and 2021 Volume Point Of Control all reside.
XRP is above all of those levels, showing some resilience and strength, while Bitcoin and Ethereum show weakness. As a result, XRP is better positioned to consolidate at its present value area rather than sell-off.
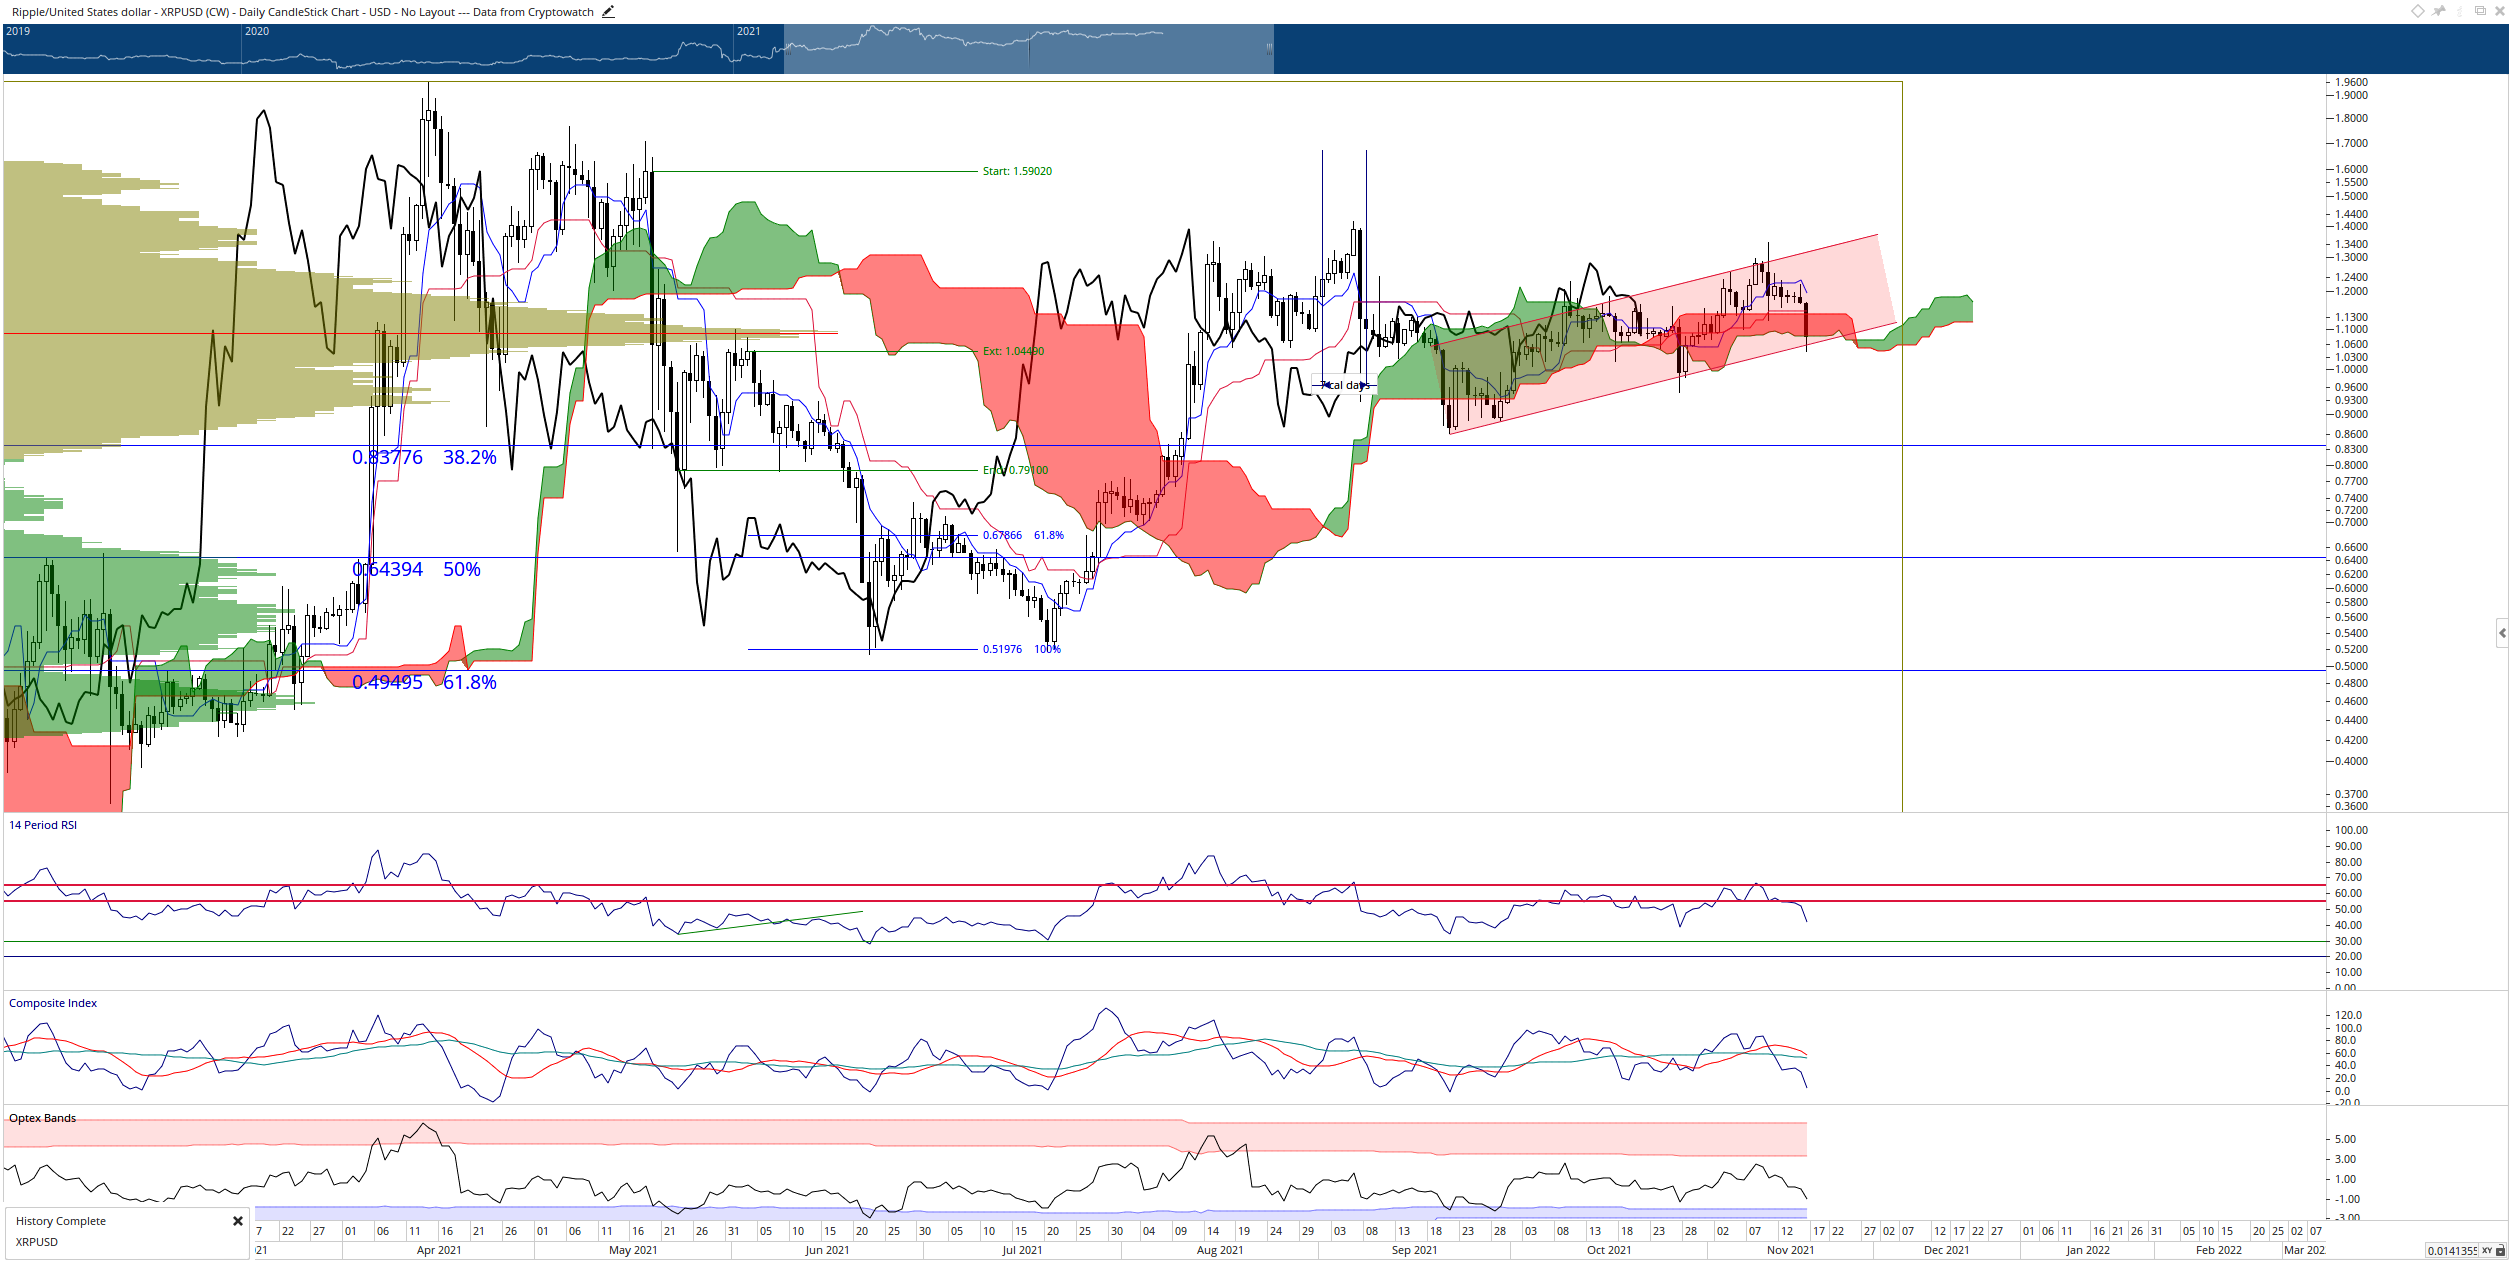
XRP/USDT Weekly Ichimoku Chart
However, threats to the downside remain for XRP. Currently it is inside a bear flag and faces all of the risks associated with that bearish continuation pattern. In addition, traders will want to watch for any daily close below $0.99 as that could trigger a flash crash to test the $0.60 value area.
Author

Jonathan Morgan
Independent Analyst
Jonathan has been working as an Independent future, forex, and cryptocurrency trader and analyst for 8 years. He also has been writing for the past 5 years.
More from Jonathan Morgan



